Saturday, 8 February 2025

The Changing Composition of Construction Employment

 Data from Australia and the United States


One of the curious things about the construction industry is the perception of it as inefficient and technologically backward, yet it has been at the forefront of many scientific and technical advance for centuries. From Gothic cathedrals to railways and airport terminals, building and construction projects have bought together the best available resources to create increasingly complex structures using the best available technology. Demand for new types of structures with greatly improved capabilities in strength and span drove the development of the modern industry during the first industrial revolution in the nineteenth century. To buildiron-framed and steel-reinforced concrete buildings the industry had to not only master the use of these new materials but also develop the processes and project management skills the new technology required, with the roles of engineers, architects, quantity surveyors, contractors, subcontractors and suppliers becoming defined by the beginning of the twentieth century. The issue then, like today, was not the availability of jobs but the quality of skills during the adoption of new technologies by the industry. 


The industry has an undeserved reputation as a technological laggard and for low skilled workers. In reality, the nature of the work attracts people with technical skills who use ‘technological thinking’ to find solutions to the problems a project will encounter between inception and delivery. Technological thinking is essentially problem-solving through trial and error. Regardless of which part of construction they work in, for the vast majority of these people there is a great deal of satisfaction in doing this work well, following relevant codes of practice and meeting the required standards.


This post looks at data on construction employment, qualifications and occupations in the Australian and United States industries. It is not a comparison, because the data is not the same, but an attempt to relate changes in the composition of the workforce to changes in the industry, such as the volume and nature of work and the types of projects. Given the data, this analysis can only be indicative and the conclusions tentative. However, there is good evidence that the industry is neither a technological laggard nor an industry with an unqualified and low skilled workforce, and that these are common misperceptions and misrepresentations of construction. 


Australian Construction Employment Trends


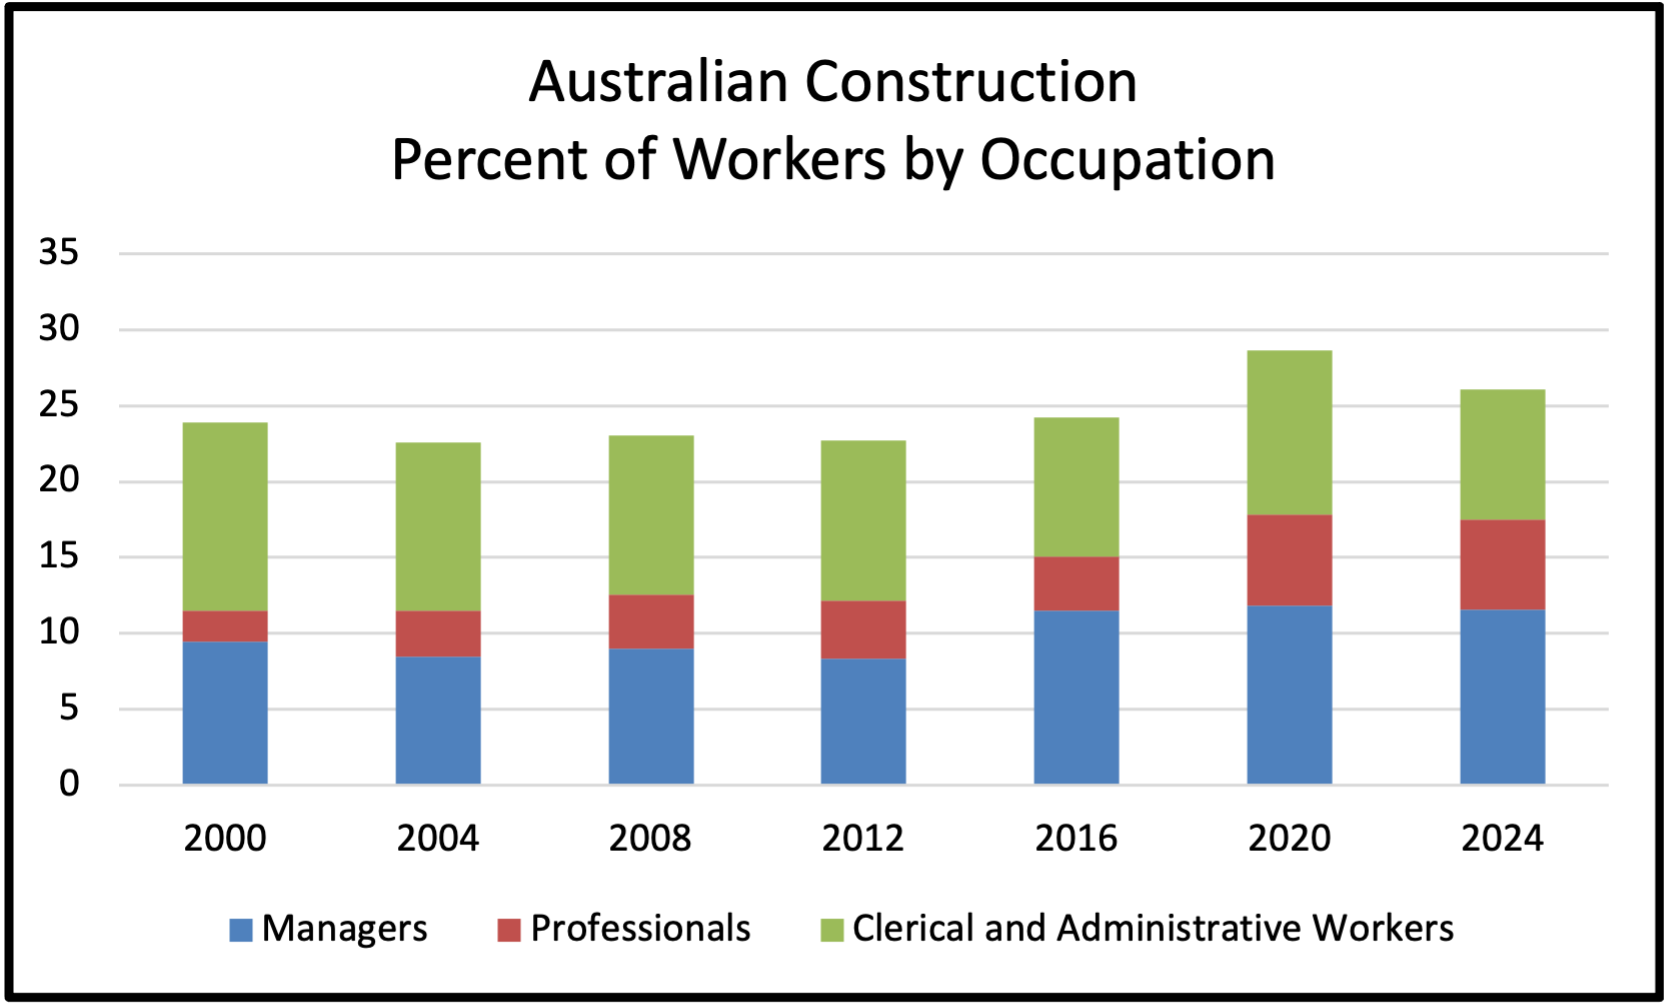
Employment in the Australian industry has grown strongly over the last couple of decades, from 664,993 people in November 2000 to 994,283 in November 2010 to 1,363,057 in November 2024 [1], and over that period there has been both stability and change in the composition of the workforce. The percentage share of Technicians and trades has been and is around 50% of the workforce, similarly Labourers have accounted for 16-17% since 2000. During the mining boom the share of Machinery operators and drivers rose to 9% in 2012, but had fallen to 6% by 2024, the lowest share since 2000. As Figure 1 shows, the combined share of these onsite workers rose from 75% in 2000 to 77% in 2012, and was 73% in 2024. 


Figure 1. Australian construction workforce composition


Source: ABS 6291 Employed persons by Industry division and Occupation.


It is in the other occupations that the major changes have been happening, and here the trends have been long-running and gradual. The share of Clerical and administrative workers has steadily declined from 12.5% in 2000 to 8.5% in 2024, falling by a third over that time. The share of professionals was 2% in 2000, 4% in 2012 and 6% in 2024. And the share of Managers has increased from 9% in 2000 to 12% in 2016, where it has been since. As Figure 2 shows, the increase in the share of professionals has been the most significant change in workforce composition.


Figure 2. Australian construction workforce composition


Source: ABS 6291 Employed persons by Industry division and Occupation.


Putting the numbers of people employed in different occupations adds some perspective. This data does not go back past 2023 because of the introduction of a revised classification system for occupations, however over the relatively short period between August 2023 and November 2024 there were some significant changes. In particular, the number of Professionals increased from 61,900 to 81,100, a dramatic change, and the number of Community and personal service workers went from 1,100 to 3,200. The number of Managers and labourers also increased, but Clerical and Sales worker numbers both fell, as did the number of Machinery operators. 


Table 1. Australian construction, number employed ‘000, by occupation


Source: ABS 6291 Employed persons by Industry division and Occupation.


Finally, another Australian Bureau of Statistics publication has qualifications and work by industry, and table 2 shows that two thirds of construction workers have gained a qualification after leaving school, and 14% have a bachelor degree or higher. 


Table 2. Construction workers by level of qualification


Source: ABS Education and Work, May 2024. 


The Australian Computer Society’s 2024 Digital Pulse report found Construction employed 12,512 technology workers (in information technology and telecommunications jobs), with 4,983 in management and operations, 2,970 in technical and professional, and 4,559 in ICT trades. That does not include the technology workers employed by the architecture, engineering and project management firms in the Professional, Scientific and technical services industry (possibly 10% of a total of 138,058 outside Computer system design and services).


United States Construction Employment Trends


In the U.S. the data is organised differently, and there are no qualifications by industry data available. There have been significant changes in the composition of the construction workforce, particularly in the last few years. For most years from 2000 to 2009 the Nonproduction employees share of total employment was between 22 and 23%, then from 2009 to mid-2017 it was 24% before rising to 25% at the end of 2017. In 2020 the share rose again to 26% and by 2024 was up to 27.5%. The number of Nonproduction employees in December 2000 was 1,503,000 and almost the same in 2014 at 1,553,000. From 2015 the number began increasing, to 1,903,000 in 2020 and 2,069,000 in 2022, and reached 2,284,000 in 2024 [2].  


Figure 3. US construction employment


Source: U.S. Bureau of Labor Statistics, Production and Nonsupervisory Employees, Construction, All Employees, Construction, retrieved from ALFRED, Federal Reserve Bank of St. Louis. 


Another series from the U.S. has a similar pattern, for the number of Managers employed in Construction in January. Employment of Managers was 335,000 in 2000 and 414,000 in 2013, before it started increasing and almost doubled, going from 428,000 in 2014 to 785,000 in 2024. Because this was a much larger increase than the increase in Nonproduction employees over that period, the share of Managers in Nonproduction employees went from 22% in 2020 to 26% in 2013 to 32% in 2022, and was 34% in2024 [3].


Figure 4. Number of managers employed in U.S. construction


Source: U.S. Bureau of Labor Statistics, Employed full time: Wage and salary workers: Construction managers occupations: 16 years and over, retrieved from FRED, Federal Reserve Bank of St. Louis.


These trends in U.S. construction employment suggest a change in the industry around 2014-15. Total construction spending was recovering from the downturn after the recession in 2008-09, when monthly spending fell below $800 million, and was back to $1 billion in 2014. By 2020 the monthly spend was up to $1.5 billion. By historical standards this was a solid recovery but not exceptional. However, between 2020 and 2024 the total spend went up to $2.15 billion, driven by a doubling of manufacturing construction to $236 million a month as a result of the Biden Administration’s industrial policies that provided subsidies to build semiconductor fabs, data centres, grid infrastructure and renewable energy sites. 


With that increase in manufacturing construction, the number of Nonproduction employees and construction Managers also increased. The timing of this cannot be a coincidence, and could be attributed to the complexity and scale of the chip fabs, data centres and other computer and energy projects underway due the subsidies provided by the Biden Administration. Further, the change in employment was a break in the existing trend of gradually increasing employment of Nonproduction employees and construction Managers. The inflection point was 2021. 


Figure 5. U.S. total construction spending, seasonally adjusted


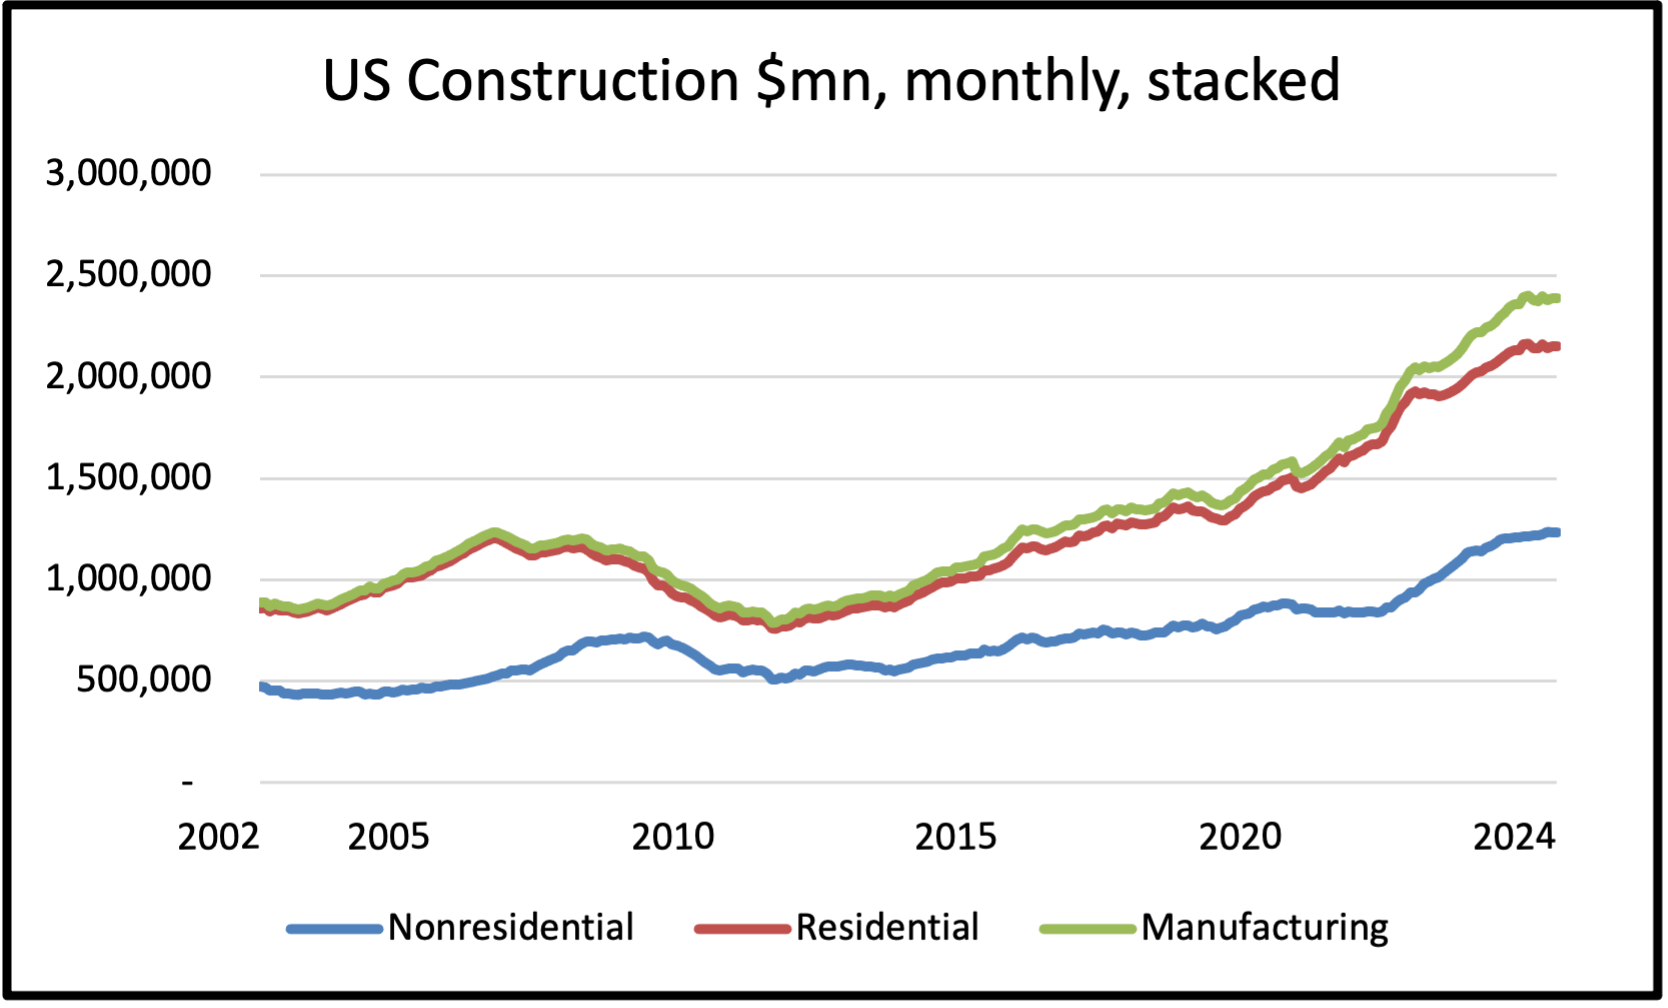
Source: U.S. Census Bureau, Total Construction Spending: Total Construction in the United States, retrieved from FRED, Federal Reserve Bank of St. Louis. 


The U.S. Bureau Of labour Statistics has detailed occupational data for 2023, but unfortunately this is not available for earlier surveys so a comparison cannot be made. However, the 2023 data is useful because it has the number employed in construction in managerial, supervisory or technical support occupations across the industry divisions of trades, non-residential and residential building, and engineering. These total 1,030,370 people, or 13% of total construction employment in 2023 of 8,120,000, which would the other half of Nonproduction employees that are not cost estimators or doing other clerical and administrative work. Many of these employees can be assumed to have a bachelor degree, for example it is a requirement for construction and architectural managers. 


As Table 3 shows, the great majority are employed as trades supervisors (609,580) and construction managers (266,140). The third largest category is architecture and engineering (103,940). The fourth is computer occupations (22,080), and fifth OH&S (19,600). The others are compliance officers (5,660) and architectural managers (3,370). 


Table 3. Number employed by occupation and industry division in May 2023


Note 1: The number here of Managers and Supervisors combined is more than the number of Construction Managers in Figure 2 above. 

Note 2: Compliance Officers evaluate conformity with laws and regulations governing licenses and permits, and excludes Occupational Health and Safety and Construction and Building Inspectors. 

Source: U.S. Bureau Of labour Statistics, Occupational Employment and Wages


Trades requiring qualifications like equipment operators (321,730), electricians (558,750), plumbers (384,870) and building inspectors (13,550) employed another 1,278,900 people. Adding these trade workers to the 1,030,370 managers and professionals above gives 2,309,270 and 28% of total construction employment in 2023 of 8,120,000. There were another 2,475,690 people employed in construction trades in 2023 as bricklayers, plasterers, painters etc., and many but not all of these workers would also have a certificate or diploma qualification. When the three groups are combined, this is over half the total number of employees. The BLS number of unqualified and unskilled workers was small, there were 858,900 laborers and 174,200 construction trades helpers.


Change Drivers


What can account for these changes in the composition construction employment in Australia and the U.S.? There are three reasons that are widely agreed on. The first is increased regulation, compliance and planning leading to more people spending more time to meet those requirements. In the U.S. there is the National Environmental Policy Act (NEPA), federal environmental legislation requires agencies to produce an environmental impact statement (EIS) before the project can start. These statements can be thousands of pages long and take years to prepare, and NEPA is a frequent target of criticism and reform efforts [4]. Some stats from a Thomas Hochman post on NEPA in December:

  • Average environmental impact statement preparation time is 4.2 years as of 2022 
  • Average review time grew from 3.4 years in 2008 to 4+ years by 2015, increasing by an average of 37 days per year
  • Average delay from environmental review publication to resolution of legal challenge: 4.2 years
  • Even a "finding of no significant impact" can take extensive time and documentation (1,200+ pages in one case)
  • Up to $400 million spent just on regulatory/environmental review process for major projects
  • Solar projects: 64% litigation rate
  • 72% of NEPA litigation initiated by NGOs


In Australia planning rules are highly prescriptive and complex, with zoning, other regulations, and lengthy development approval processes reducing the ability of housing markets to respond to demand. Research on apartment prices in 2020 and house prices in 2018 by the Reserve bank found planning and zoning restrictions raised prices by up to 70%. A 2021 survey by Infrastructure Australia found: ‘Contractors and investors viewed planning and environmental approval processes as an unpredictable risk to project timelines and a driver of delay. The need to coordinate across multiple layers of government to obtain approvals, and the requirement to meet increasingly onerous conditions attached to many approvals, (e.g. in relation environmental approvals) prompted concern over delivery times’ (p.44). 


A second reason is the digitisation of construction and use of BIM leading to increasing offsite employment and project planning. A 2023 Brookings Institute report found only 23% of U.S. jobs were ‘low digitalisation’ in 2020 compared to 52% in 2003. From 2002 to 2010 the share of occupations with a high digitalization level doubled, from 9% to 18%, and in 2020 rose to 26%. A 2021 report by RMIT University found that 87% of jobs in Australia require digital literacy skills, and the 2024 submission by Industry Skills Australia to the Commonwealth Government’s Inquiry into the Digital Transformation of Workplaces (available here with all the other submissions) predicted only 45% of construction jobs would not be impacted by digital technology by 2030.


And a similar argument has increasing offsite manufacturing reducing the number of workers onsite and raising the proportion of offsite workers. The actual extent of the effect is unknown, but is likely to be marginal as the point is not replacing workers but moving them offsite, and there is still substantial site preparation and assembly work involved. Offsite manufacturing also requires detailed digital design and production planning work. 


Conclusion


The construction industry is neither a technological laggard nor an industry with an unqualified and low skilled workforce. These are common misperceptions that probably are often the result of people seeing poorly organised and managed sites, which could be addressed through better site facilities and maintenance. In fact, the industry employs a wide range of skills and requires technical competence from the majority of its workers. In Australia, two thirds of the workforce have a post-school qualification, and in the U.S. it is over half. In both countries the share of unskilled labourers is small, at around 10% of the workforce [5]. 


There are other interesting parallels between Australia and the U.S. In Australia, the share of professionals rose from 2% in 2000 to 6% in 2024, and the share of Managers increased from 9% in 2000 to 12%. Adding the 2024 8% share of Clerical and administrative workers makes 26% in these occupations. In the U.S. between 2014 and 2020 the share of Nonproduction employees rose from 24% to 26%. In both countries the number of Managers has increased by 50%. The share of workers with a bachelors degree or higher is also the same, around 14%.


Why, despite the differences in scale and output mix in the two countries, is the composition of the workforce so similar? To some extent it must be because the methods and processes followed in design, development, construction and project management are similar, as is the use of machinery and equipment. There is not a lot of difference in some types of projects, such as commercial and institutional buildings and road and rail infrastructure. Another factor would be the geographical dispersion of activity, both are large countries and work is spread out across regions. 


The trend in both countries is toward fewer low skilled jobs, and this applies to both onsite labourers and offsite clerical and administrative workers. An increasing share of jobs requires qualifications, and more of these workers have university qualifications. This is not to suggest there will be no unskilled workers in future construction, but there is no reason to believe these trends have run their course. 


                                                                            *


[1] Discussed in a previous post Australian Construction and the Shortage of Workers

[2] Production employees include working supervisors and all nonsupervisory employees engaged in production operations. Nonsupervisory employees includes office and clerical workers, repairers, salespersons, operators, drivers, laborers and other employees at similar occupational levels. 
[3] Construction Managers: Plan, direct, or coordinate, usually through subordinate supervisory personnel, activities concerned with the construction and maintenance of structures, facilities, and systems. Participate in the conceptual development of a construction project and oversee its organization, scheduling, budgeting, and implementation. Includes managers in specialized construction fields, such as carpentry or plumbing. From the Bureau Of labour Statistics 
Standard Occupational Classification

[4] For a history and how NEPA works see Brian Potter https://www.construction-physics.com/p/how-nepa-works. For a survey of research see Noah Smith https://www.noahpinion.blog/p/the-big-nepa-roundup. For comprehensive data see Thomas Hochman https://www.greentape.pub/p/nepastats and why reform is necessary https://www.greentape.pub/p/revisiting-pro-nepa-studies  

[5]  The review of the UK's ITBs by Mark Farmer has just been released. It was done in 2023 and the data is for 2020, but it says on page 41:

"In terms of the job role make up of the construction industry, 57% are elementary level, plant or trade craft operatives. Professional, management and technical roles constitute 33% of the workforce with 10% of the workforce are in support or administrative roles.

In terms of attainment, 73% of the workforce are at level 3 and below, including 5% who are unqualified. 21% are degree level or above qualified."

Interesting because similar to Australia and the US.

https://www.gov.uk/government/publications/2023-industry-training-board-itb-review


Thursday, 16 January 2025

Flyvbjerg and Gardner’s How Big Things Get Done

 Projects Minor, Major and Mega


These days we live and work in a world of projects, with everything from planning a holiday, a product launch or a political campaign seen as a project. Organisations have project teams and use project-based management systems. There is a project management book of knowledge, known as the PMBoK, taught in the many PM courses now available.


Major projects, and public projects in particular, are frequently associated with cost blowouts and schedule slippages. Some projects become notorious for cost overruns, like the Sydney Opera House (1,400 percent), the Scottish parliament building (1,000 percent) or Boston’s Big Dig tunnel (600 percent). In fact, the great majority of large projects like airports, pipelines, tunnels, railways and roads are not delivered on time or within budget. Software projects are rarely delivered on budget. However, about 20 percent of major projects are delivered on time and on or below estimated cost, so although that may be difficult and unusual it is not impossible.


The 20 percent success rate comes from a database of major projects built by Bent Flyvbjerg, a Danish researcher now at Oxford University. Starting in the early 1990s he began collecting project cost and time data, initially for transport (roads, rail and bridges) then extended to include water, power, oil and gas, IT, and aerospace projects. That data became the basis for many journal papers on project performance and the 2003 book by Flyvbjerg, Bruzelius and Rothengatter Megaprojects and Risk: An Anatomy of Ambition


Flyvbjerg and his colleagues coined the phrase ‘Survival of the unfittest’ to describe projects that get approved and built despite their poor economic and financial characteristics and outcomes. Their key characteristics of projects are:  

  • They are inherently risky due to planning horizons and complex interfaces between the project and its context, and between different parts of the project;
  • Costs and benefits are many years in future, and are large enough to change their economic environment with unintended consequences;
  • Stakeholder action creates a dynamic context with the escalation of commitment driven by post hoc justification of earlier decisions;
  • Decision making and planning are processes with conflicting interests;
  • Often the project’s scope or ambition changes significantly after starting work;
  • No allowance is made for unplanned events (known as ‘black swans’) so budget and time contingencies are inadequate;
  • Misinformation about costs, benefits, and risks is the norm, and in some cases is strategically misrepresented to get a project started and ensure commitment;
  • The result is cost overruns and/or benefit shortfalls with a majority of projects.


There is also the 2023 book from Flyvbjerg and Dan Gardner, How Big Things Get Done: The Surprising factors Behind Every Successful Project, From Home Renovations to Space Exploration. Thanks to Gardner’s contribution this is a brisk, readable book, not another academic tome, and it made its way onto the best business books lists of the Economist, Financial Times and McKinseys. Although it covers the factors and issues in the 2003 book there is less data and analysis, and this book has more examples of different types of projects (buildings, films, tunnels, railways etc.) and the people responsible. Each of the nine chapters addresses a specific issue, illustrated by interesting stories about the people and projects featured, and presents a key concept, the ‘universal drivers that make the difference between success and failure’. 


The first chapter is ‘Think slow, act fast’, meaning plan thoroughly and as completely as possible before staring work, or ‘think first, then do.’ Once started a project should be delivered as quickly as possible, to reduce the risk of something going wrong. The chapter has data from Flyvbjerg’s database of 16,000 projects: 91.5% go over their time and budget; 99.5% go over cost and time and under-deliver on benefits. The typical project has underestimated costs and overestimated benefits, and the risk of a project going disastrously wrong (not 10%, but 100% or 400% over budget) is surprisingly high. 


Chapter 2 is ‘The commitment fallacy’, where projects are approved before alternatives are explored and/or continued after money has been spent (the start digging a hole strategy). Strategic misrepresentation is an organisational and institutional explanation where project promoters produce biased appraisals at the approvals stage (underestimated costs + overestimated benefits = approval) and projects that get funded are ones that look best on paper (i.e. have largest errors) not the best projects. Another explanation is psychological, from Daniel Kahneman’s ‘planning fallacy’ for decisions based on delusional optimism about the time needed to complete tasks. Premature commitment leads to poor outcomes because people assume What You See Is All There Is – the WYSIATI fallacy – focusing exclusively on what is in front of them and not exploring alternatives. 


In chapter 3 a kitchen renovation is the example, a project that expanded and grew after starting and blew its budget. Although planned well it did not start by asking ‘why are you doing this?’ The point is to decide what the project is for first, before thinking about how to achieve that goal. The first requirement for a successful project is to select the right one, and whether or not to proceed. Chapter 4 is ‘Pixar planning’, which is spending a lot of time exploring an idea with many iterations to get to proof of concept stage. Often repeated advice is the three words ‘Try. Fail. Again.’ The authors say we are good at learning by tinkering, ‘which is fortunate because we’re terrible at getting things right the first time.’ Chapter 5 argues for the importance of experience and tacit knowledge, and shows how common it is for such a basic insight to be ignored. 


Chapter 6 introduces Reference Class Forecasting, a solution to optimism bias and the illusion that a project is unique. This involves three steps: Identification of a relevant reference class of past, similar projects; establishing a probability distribution for the reference class; and comparing the specific project with the reference class distribution. From the comparison reliable forecasts of a project’s budget and schedule can be made. In chapter 7 the idea that ingenuity and creative chaos leads to great outcomes is refuted, it is the occasional success, which is an exception, that makes this such a good story. 


The importance of getting the team right is Chapter 8, with British Airport Authority’s 2007 Heathrow Terminal 5 the example project. This was a famously successful megaproject. The delivery of T5 on time and on budget, with a remarkable safety record, was due to the three inter-related factors of risk management, integrated teams, and the alliance contract. BAA held all the risk and an incentive contract meant suppliers and contractors were motivated to find solutions and opportunities. BAA used in-house project management teams where traditional boundaries were broken down and replaced by colocation, so people from different firms worked in integrated teams in BAA offices under BAA management. The focus was on solving problems before they caused delays.


Chapter 9 argues modularity delivers projects, faster, cheaper and better because it allows repetition, and repetition allows learning by doing. Rather than building one huge thing the Lego approach is to make modules that can be assembled into buildings, cars, cakes, satellites and subway stations. In the database the most successful projects (i.e. least likely to have cost overruns) are energy projects for solar, wind and thermal generators that are inherently modular. At the other extreme are nuclear power plants and waste storage, hosting Olympic Games, and hydroelectric dams, ‘all classic ‘one huge thing’ projects’. The chapter closes with an appeal to address climate change through building out the energy transition as quickly as possible. 


The book ends with eleven heuristics for better project leadership that collect the book’s key points. These are ‘rules of thumb used to simplify complex decisions’ such as: Hire a masterbuilder; Get the team right; Take the outside view (i.e. use a reference class); Build with Lego; Think slow but act fast; Think right to left (i.e. start with your goal, then identify the steps to get there); and Say no and walk away. Although these may seem obvious, the point is how often they are not followed and how many projects go over time and budget, and areled by people with only partial competence with no provision made for black swan events.


Flyvbjerg and Gardner argue a significant reason for poor decisions on projects is unwarranted optimism about outcomes, the planning fallacy. Planners underestimate the time, costs, and risks due to size, gestation and time for delivery, and overestimate the benefits of projects. In some cases there is strategic misrepresentation of costs and benefits. After a project has started there are the risks of escalated commitment and lock-in, scope changes, and conflicting interests. None of these risks are unknown or mysterious, which raises the question of why so many projects have such poor outcomes. 


The answer is often the quality and competence of project managers. A 2016 infrastructure report from the McKinsey Global Institute, the think tank for the management consultancy, found ‘Cost overruns for large projects average 20 to 45%. We often see cost differences of 50 to 100% in similar projects carried out by different countries, even those in similar income levels. If countries apply the best practices that have already been proven effective elsewhere, they can achieve remarkable results.’ McKinsey argued a key factor was the quality of the project manager, as their research ‘across thousands of projects indicates that top quartile project managers consistently deliver projects ahead of time and below cost, whereas the opposite is true for the bottom quartile’. 


That said, how likely is it that project managers will read How Big Things Get Done? Probably not enough, if McKinsey is right about how little best practices are copied. Although the book is about projects, it does not specifically include or refer to the PMBoK toolkit of processes and knowledge areas, that project management qualifications are based on. Also, while the examples used of architects like Jørn Utzon and Frank Gehry, Pixar movies, iPods, the Empire State Building and Heathrow Terminal 5 are interesting and revealing, because they are unusual and exceptional projects many project managers might not accept that the lessons taken from those projects are widely applicable.


It may be the real audience for the book is clients and owners rather than project managers. The client ultimately has responsibility for a project, even if they try to unload this onto a project manager. Much of the advice, on project selection, planning, iteration, contingencies and modularity for example, is about the development stage of a project when the client is or should be in control, not the delivery stage after work commences when the project manager is responsible. And the important message the book sends is that the success or failure of the great majority of projects is determined early on, during planning and development.  


                                                                      *


Bent Flyvbjerg and Dan Gardner, 2023. How Big Things Get Done: The Surprising factors Behind Every Successful Project, From Home Renovations to Space Exploration. New York, Currency Press. 


Flyvbjerg, B., Bruzelius, N. and Rothengatter, W. 2003. Megaprojects and Risk: An Anatomy of Ambition, Cambridge, Cambridge University Press.


Saturday, 4 January 2025

Review of Ed Merrow's book Industrial Megaprojects


It is well known that the future is uncertain, where uncertainty is an unmeasurable or truly unknown outcome, often unique. This can be clearly seen on large infrastructure projects, which often bring into focus the issues around project selection. A remarkable number of these projects are unsuccessful, by exceeding their time and cost estimates, or inefficient because their returns and/or benefits are well below forecasts.

Major infrastructure projects and other megaproject costs and benefits are many years into the future, and any estimates of them will depend on the assumptions and type of model used. They change their economic environment, generate unintended consequences, and always have the possibility of escalation of commitment driven by earlier decisions.

Ed Merrow did the first published study on major projects costing over US$1 billion (known as megaprojects) for the US military think tank RAND Corporation in 1988, on 52 private sector projects – refineries, oil, transport, and nuclear. It looked at time and cost performance and the factors that drive the outcomes on these projects. Most met performance and schedule goals, but only four came in on budget with an average cost growth of 88%. He concluded “The larger the project, the more important is the accuracy of early estimates.” (1988: 80). This remains the key issue.

Merrow set up Independent Project Analysis to provide project research for heavy industry and the process and extraction industries. Depending on the project, between 2,000 and 5,000 data points are collected over the initiation, development and delivery stages. From this database companies can compare their project with other, similar projects, across a wide range of performance indicators. The data gives estimates on approval, design and documentation, and delivery times for the type of project, and allows for factors like location, access and complexity in costs. When Merrow published his book Industrial Megaprojects in 2011 the IPA database had 318 megaprojects, out of about 11,000 projects in total, from industries like oil and gas, petroleum, minerals and metals, chemicals, and power, LNG and pipelines.

In his 2011 book Merrow recommended a process he called front-end loading, and his best examples of project-definition reduced project timelines and cost by roughly 20 percent. He saw projects having three stages, the first evaluates the business case, the second is scope selection and development, and the third is detailed design. His argument was that there needs to be gates between the stages that prevents less viable projects from getting to authorisation. He emphasises the ‘period prior to sanction of the project.’

Using evidence from the 11,000 projects in his database Merrow argued the best form of project delivery is what he called ‘mixed’: hiring engineering design contractors on a reimbursable contract then construction contractors on a separate fixed price contract. His view was this is the most effective form of project organization, basically traditional construction procurement where consultants are appointed to do the design and a competitive tender is held for one or more contractors to execute the works against a complete design.

Merrow also argues the owner’s job is to select the right project and the contractor’s job is to deliver the project as specified, on time and on budget. In his view contractual relationships are more tactics than strategy, and cannot address any fundamental weaknesses in the client’s management of the project, in particular the client ultimately has to own the design. This crucial point became widely recognised by the private sector clients/owners of large engineering projects that Merrow studied, because they understood that significant risk transfer from clients to contractors is structurally impossible on the projects they undertake.

Design and delivery of major projects can be contracted separately to reduce project costs and risks so that, as far as possible, design and documentation is complete or nearly complete before tendering. The ‘nearly complete’ qualifier is important. A simple project can be fully specified just because it is simple. However, there is a limit to how much design can be completed in the initial stages of a major project, because the specification of a major project develop over time as the project details are refined and defined. Therefore, it is unreasonable to expect a major project to be fully specified at tender, and in most cases this would not be possible. On the other hand, it is not unreasonable for tenderers to expect the documentation they receive to be sufficient, because the extent and clarity of the design determines their project time and cost plans.

There are a number of advantages of this strategy of unbundling design and construction, particularly for major projects. Breaking a project into smaller, sequential contracts spreads the cost out over time, and does not incur interest costs if a loan is not used for design work. It makes quality control easier and more effective, by being focused on each stage, which is an important risk management tool. Separating the design stage from tendering and construction will also improve opportunities for consultation with the community and stakeholders. Most importantly, completion of design and documentation before tendering reduces contractor risk and therefore total project cost.

This argument is for design and construction of projects to be contracted separately, because this will reduce project costs and risks. As far as possible, design and documentation should be complete or nearly complete before tendering or starting the works. The key factor is therefore the extent of the specifications, on some projects there may be a limit to how much design should or could be completed upfront. For many major projects these develop over time as the project details are refined and defined. It is unreasonable to expect a complex project to be fully specified at tender, and in most cases this would not be possible. It may also be advantageous to look for innovative ideas or design options, so for these projects an incremental approach would allow contractors and suppliers the opportunity for input during the development of the design. This also has the advantage of reducing uncertainty from poor tender documentation, thus lowering risk and cost for tenderers.

To deliver better results in on-time and on-budget delivery, Merrow argues project developers or sponsors should spend 3 to 5 percent of the cost of the project on early-stage engineering and design. This is because the design process will often raise challenges that can to be resolved before construction starts, saving time and money.

If more realistic, and therefore more accurate, time and cost estimates were given for major infrastructure projects before they are approved, and during the design and development stages, there would be fewer recriminations about project performance and less incentive to find scapegoats on completion, which is typically over budget and schedule. There would be fewer of the common accusations of poor productivity, management failures or poor planning, thus lessening the atmosphere of acrimony that often surrounds major projects in their later stages


Merrow, E.W. 1988. Understanding the Outcomes of Megaprojects, RAND Corporation, Santa Monica.

Merrow. E.W. 2011. Industrial Megaprojects: Concepts, Strategies and Practices for Success, Wiley, Hoboken, NJ. Second edition 2024. 


Saturday, 14 December 2024

Can AI Solve the Construction Productivity Problem?

 Will artificial intelligence reduce hours worked or time taken to complete a project?


There has been little or no growth in construction industry productivity for many decades, and there have been many different reasons given. These include larger and more complex buildings, longer and more global supply chains, increased regulation and compliance requirements, temporary project teams, the cycles of boom and bust in construction work, increasing use of prefabrication and offsite manufacturing, the number of low productivity small firms, low industry capital intensity, and a lack of workforce skills and training. All these and more contribute to a complex problem. 


Over the decades various solutions have been proposed, such as total quality management in the 1980s, lean construction in the 1990s, BIM in the 2000s, and digital twins in the 2010s. Often criticised as top-down, technocratic solutions when imposed by governments, with BIM mandates for example, the reality is the great majority of firms in the industry, particularly small and medium sized ones, have not adopted them unless required by clients. Clients, in turn, have not been prepared to increase costs or risk innovation on their projects to benefit the industry, a classic catch 22 situation.


Now there is a new solution to the productivity problem. Since the launch of Chat-GPT in November 2023 there have been dozens of artificial intelligence (AI) models released, and widely used software from majors like Microsoft, Oracle, Trimble and Autodesk now has AI incorporated into their systems. Will this time be different, or will AI follow BIM and the other solutions proposed in the past, and be adopted piecemeal when required without changing industry productivity and performance? 


In the previous post around 100 companies with construction related AI systems were included, divided into six areas: preconstruction and estimating; project and document management; site monitoring and safety; equipment management and maintenance; design and planning; and materials. This post discusses the potential of AI to solve the construction productivity problem. It looks at how AI might reduce the number of hours worked or decrease the time taken to deliver projects, considering its potential effects in equipment management and maintenance, preconstruction and estimating, project and document management; and site monitoring and safety. Issues in worker and workplace monitoring are discussed, because there is also the possibility AI will make the industry a worse place to work, which has been the experience of call centres, warehouses and Uber drivers, industries where AI is already intensively used. 


Can AI Improve Construction Productivity?


Labour productivity is the ratio of an industry’s inputs, usually the number of hours worked, to output, the value of production minus the cost of inputs. To improve productivity the relationship must change, for example increasing output faster than hours worked or decreasing hours worked while maintaining output will both increase productivity. Although that seems pretty straightforward, there are many issues that complicate measurement, ranging from how data is collected and managed to adjustments for price and quality effects. Those data issues are more difficult for capital productivity, which measures the contribution of buildings, structures, plant, machinery and equipment to output, adjusted for age and depreciation. 


Also, productivity does not change much from year to year, currently increasing by less than one percent a year for the Australian economy as a whole, and so is gradual and cumulative, and works over the long-run. Even in high growth periods and economies, annual productivity increases of around three percent are common. Therefore, productivity is not a good target for industry policy. Finally, the statistics used for construction include onsite work and people employed by contractors and subcontractors only, and thus exclude important activities like offsite manufacturing and prefabrication, and design, technical and professional services.


There are three factors that will affect improvement in industry productivity from AI. First is the adoption rate of AI by firms, which will be the key driver because the more firms that use AI the bigger the effect. However, second, AI productivity gains may be concentrated in a few firms, lowering the overall level of industry productivity improvement. Third, some or many physical or manual tasks may be affected by AI through robotics, which is outside the discussion here. Onsite construction robots were covered in this recent post


A November 2024 OECD publication on the productivity effects of AI over the next decade included industry estimates of the share of tasks affected by AI using two measures, a baseline exposure for the share of tasks that time for completion substantially decreases using Generative AI, and an expanded capabilities measure that includes tasks where gains are achievable if other software is developed on top of current systems. The largest gains are in ‘knowledge-intensive services that rely strongly on cognitive tasks, such as Finance, ICT services (including telecoms), Publishing and Media, and Professional services. The least exposed sectors include sectors with a strong manual component, such as Agriculture, Mining and Construction.’


Figure 1. Share of tasks affected by AI


SourceMiracle or Myth? Assessing the macroeconomic productivity gains from Artificial Intelligence. OECD Working Paper. 2024: 19.


The OECD study looked at tasks and the extent to which AI can do or help with. High exposure means it has a large share of tasks that AI can assist with, and there are only half a dozen high exposure industries. Although construction is at the lower end of the range, 20 to 30 percent of tasks could be AI assisted, which is comparable to metal and plastic manufacturing and warehousing, and not far behind transport, fabrication, motor vehicles, and water and waste. There are, therefore, plenty of potential productivity gains for construction from AI.


How AI Might Improve Construction Productivity


There are two ways AI might affect construction productivity: it could reduce the total number of hours worked on a project or it could decrease the time taken to complete a project. Note, however, if AI had both of these effects they would cancel out and productivity would not change.  


The most straightforward use of AI is for equipment management and predictive maintenance. If these increase the availability and reliability of machinery and equipment there will be an increase in productivity from less downtime for operators, hours worked might not change but output would increase, and that would also decrease time taken to complete. The impact and importance of this on productivity depends on how unreliable equipment currently is. If contractors and operators are aware of the liabilities and costs of breakdowns and do adequate maintenance, any improvement from AI will be at the margin, however both labour and capital productivity would improve. 


In preconstruction and estimating, AI could cut time and reduce mistakes. All construction firms do estimates, and using AI and image recognition for automated quantity take-offs from drawings, PDFs and BIM, and scanning drawings to count items and check for missing information and risk assessment seems an obvious way to save time. That data can be given to estimating systems that also do BQs, cost plans, bidding automation, indirect costs, KPI analysis, and predictive analytics. For larger firms doing design and build work, AI systems that do generative design, site layouts, materials selection, planning and code compliance checks would be useful. Although important for individual firms, the effect on overall industry productivity of reducing hours worked in these offsite functions would be offset by the much larger number of hours worked onsite. AI could make a major difference to productivity if it improves project management.


Because of the large number of different project documents used, copilots, AI assistants and chat bots that search, summarise and analyse those documents on request is another obviously useful task for AI that would be relevant to most firms in the industry. If site and project managers spend much time searching for information and retrieving documents, and suppliers and subcontractors have to wait for instructions, this would be an efficiency gain that could reduce both hours worked and completion time for projects. 


Document management can also include project management functions like bidding, billing, payments, RFIs, claims and compliance management. Other AI assisted PM offers are task plans and schedules, risk assessments, status reports, workflows, resource management, ITPs and quality assurance, and site management. Some systems have collaboration and communication tools. How much difference could using AI for these make to PM and productivity? Tasks like scheduling, work plans and status reports are time intensive, so AI can improve productivity by reducing the hours required. Better onsite collaboration and communication can potentially reduce the time to complete, particularly on large projects where coordination is more important. 


For AI enhanced PM to improve industry productivity it would have to become widely used, and that depends on how much it improves the capability and competitiveness of firms using AI. If there are significant benefits to early adopters of AI they will be able to out-compete other firms, that will then have to become fast followers to survive. Whether or not AI will deliver meaningful reductions in hours worked, and those significant benefits are available and achievable, is an open question at this point. 


Finally, site monitoring and safety. Reality capture and computer vision systems match site work to digital twin and BIM models to track progress.  These design vs as-built comparisons can be done by drones or hand-held cameras and provide daily or real-time progress tracking, with time saved on reports and documentation a useful improvement, and possibly leading to an important reduction in disputes and defects. However, the main effect on productivity will depend on how well this information is used to improve project management, particularly collaboration and communication. 


Safety systems monitor sites and detect hazards, and dangerous behaviour by people, and can prepare safety plans. While important, this will not have much effect on productivity, although reducing injuries and time off work for recovery would have an indirect effect. Some of these systems also identify people using sensors, cameras and wearables like beacons and badges, and can also be used for access control, headcounts, timesheets, task and workforce management. Again, there can be time savings in these administrative functions, however, worker and workplace monitoring raise a number of important issues. 


Monitoring and Algorithmic Management


In Australia workplace monitoring and surveillance is covered by a mix of federal and state laws. The Privacy Act 1988 doesn't explicitly address workplace surveillance, but has 13 Australian Privacy Principles that employers must follow when handling personal information and data collected through monitoring. Employers can monitor employees to ensure they are doing their work and using resources appropriately, but should only monitor employees to the extent necessary to achieve a legitimate business purpose. Employees have to agree to have their data shared. The states have two laws that regulate workplace surveillance, one is a Privacy Act requiring compliance with the Australian Privacy Principles (in NSW a Workplace Surveillance Act), and the other a Surveillance Devices Act that regulates the use of surveillance devices in public places and workplaces [2].  


Monitoring with AI becomes controversial when it is used for ‘algorithmic management’, where workers are monitored, ranked, rated, given instructions, potentially harmed or auto-fired by an AI system. In the current dispute between Woolworths and the United Workers Union a worker performance management program called ‘The Coaching and Productivity Framework’ that was introduced across warehouses is a major issue. The December 7th Sydney Morning Herald article on the dispute said the ‘point of contention is the disciplinary action workers face if they fail to achieve 100 per cent adherence to pre-determined pick rates. What was previously a non-enforced goal is now a mandatory requirement.’


In the US the Federal Trade Commission has authority to block unfair trade practices, and a recent speech by commissioner Alvaro Bedoya argued algorithmic management is an illegal unfair trade practice. Because it causes substantial injury, can’t be reasonably avoided, and isn’t outweighed by a countervailing benefit, Bedoya says algorithmic management satisfies the three criteria for an unfair trade practice.


He gives three examples. First, on substantial injury, Bedoya describes a warehouse worker injured while working for ecommerce sites monitored by an AI that required him to pick and drop an object off a moving belt every 10 seconds, for 10 hours a day. Workers are tracked by a leaderboard, supervisors punish workers who don’t make quota, and the algorithm auto-fires them if they fail to meet it. Second, Bedoya describes the experience of New York rideshare drivers when the apps start randomly suspending them, telling them they can’t book a ride. Drivers who stop for coffee or use a bathroom are locked out for hours as punishment. Third, on average a call-centre worker is subjected to five forms of AI, with AI video and voice monitoring to measure empathy, an AI timing calls, and two more to analyse calls. AIs produce transcripts of calls, but workers with accents find them ‘riddled with errors’ and their performance assessment is based on the transcripts. 


Given these considerations, construction employers who hope AI monitoring of workers will improve productivity should approach this idea with great caution. Workers have the right to know what data is being collected, who it’s being shared with, and how it’s being used. 


Conclusion


Industry productivity is the combined effect of both capital and labour productivity, and AI adoption can lead to broad and long-run gains in construction productivity as AI assistants take over time consuming tasks like report writing and document management, and AI systems improve resource and project management. The potential productivity gains from AI are significant, but there are factors that could limit the effect, such as the willingness of firms to adopt AI, their capabilities, skills, and access to data. Also, AI adoption across the industry is likely to be uneven, and the productivity benefits of AI will tend to go to firms that use other advanced technologies and have IT skills. 


Two construction tasks that AI could significantly improve are estimating and project management, because it can synthesise, summarise and interpret data, and provide insights and suggestions, although it cannot replace expertise and requires supervision and checking of results. AI would also make a major difference to productivity by saving time used for document management, through quicker access to information, by reducing mistakes, disputes and defects, and could lead to more and better collaboration and communication. 


To improve construction industry productivity, AI has to increase efficiency and reduce the hours worked or decrease the time taken to complete a project, although if AI had both of these effects they would cancel out and productivity would not change. Therefore, productivity is not the most appropriate metric to use for industry-wide effects of AI, rather it should be used to measure productivity improvements in specific tasks where AI can assist workers. 


In addition to productivity there are other labour market implications not discussed here, such as the effects of AI on recruitment, retention and wages, and ongoing demographic changes such as the ageing workforce. Also, the history of technologies like electricity, internal combustion engines, computers and the internet show it typically takes two to three decades for a new technology to become widely used and to significantly affect the economy and productivity. AI may be different, but probably not. Modern AI began with Alpha Go in 2016, so we are almost a decade on already and the next decade could see rapid uptake of the AI systems surveyed in the previous post.


At this stage it is impossible to know whether AI will deliver on its potential productivity gains. That will depend on how the technology continues to develop, how quickly AI is adopted and successfully applied, associated innovation-boosting effects, and how government policy on incentives, digital infrastructure, AI regulation and data develops. 


                                                                     *


[1] Progress in AI may be slowing down. GPT-4 is nearly two years old, but The Information said OpenAI’s new models have only incremental improvement, and Reuters quoted Ilya Sutskever, co-founder of OpenAI, saying results from scaling up pre-training have plateaued. 


[2] For more details see the Office of the Australian Information Commissioner about workplace surveillance: https://www.oaic.gov.au/privacy/your-privacy-rights/surveillance-and-monitoring/workplace-monitoring-and-surveillance