Is the industry’s productivity as bad as claimed?

The Australian Bureau of Statistics publishes productivity measures for the whole economy, the Market Sector, and for the 16 industries that make up the Market Sector. Productivity is the ratio of output and inputs and is affected by innovation, research and development, education and training, the quality and age of the capital stock (of machinery, plant and equipment, buildings and structures), the rate of technological change and adoption of new technologies. The effects of all these factors takes time, so productivity is a long-run measure that changes gradually.
The post compares Construction productivity to the performance of the Market Sector. The data used is from the annual ABS Productivity Statistics release, which has data from 1994-95 to 2023-24 (the most recent release was February 2025). The ABS productivity indexes are based on 100 in 2022-23, however for this analysis they have been first rebased to 100 in 1994-95 to compare the long-run growth of Construction and Market Sector productivity, and then rebased at 100 in 2015-16 for comparing productivity in the short-run.
Comparisons are made for labour productivity and multi-factor productivity (MFP) using both the hours worked and quality adjusted labour input measures. The quality adjusted labour input indexes take into account characteristics of the workforce like years of education, levels of training, industry of employment, age and sex. These quality adjusted measures reflect changes in the composition and skills of the workforce, and typically have a lower rate of growth than the hours worked measure. Capital productivity is also shown.
As well as comparing the different measures of productivity for Construction and the Market Sector, there is data for the individual industries that shows Construction is in no way the worst performing industry, although it is far from the level of growth seen in the best performing industries.
Productivity Since 1995
The long-run performance of Construction includes a sharp rise during the mining boom between 2012 and 2015, followed by a gradual decline over the next few years as these major resource projects completed [1]. At the end of the mining boom productivity had fallen to around the level it was before the boom. This pattern was due to the large increase in Construction output during the mining boom because output included plant and equipment like the offshore drilling platforms and gas liquefaction plants, none of which involved much construction work and most of which was imported. Productivity increased because this statistical quirk increased output much more than employment and hours worked [1].
Labour Productivity
Starting with labour productivity over the long run since 1994-95, the difference between growth in the Market Sector and the lower productivity growth of the Construction industry is apparent in Figure 1. However, despite claims made that there has been no growth in Construction labour productivity, there has been an increase. Construction labour productivity has increased by 17% on an hours worked basis and 24% on the quality adjusted labour input basis which, although less than the Market Sector’s 64% and 41% respectively, is not nothing.
Figure 1. Market Sector industries labour productivity

Source: ABS 5260. Gross value added per hour worked. Quali is the quality adjusted labour input measure.
As Table 1 shows, since 1995 the three leading industries for hours worked labour productivity growth have been Agriculture, forestry and fishing 210%, Information media and telecommunications 228%, and Financial and insurance services 123%. The two industries with lower growth than Construction were Mining 6%, Electricity, gas, water 2%, and Administrative and support services had negative growth of -13%.
For quality adjusted labour productivity, Construction had better growth than Rental, hiring and real estate services 4%, and there were three industries with negative growth: Mining -2%, Electricity, gas, water and waste -9%, and Administrative and support services -23%.
Table 1. Market Sector industries labour productivity change

Multi-factor Productivity
The ratio of output to input of combined labour and capital is multi-factor productivity (MFP). For MFP the story is not as good as for labour productivity, because there has been only 1% growth in Construction hours worked MFP and a 3% fall in the quality adjusted measure. Market Sector growth on the hours worked basis was 23% and on the quality adjusted labour input basis was 13%. After MFP rose and fell during the mining boom, instead of returning to the preboom level there was collapse in Construction MFP after 2015-16.
Figure 2. Market Sector industries multi-factor productivity

Source: ABS 5260. Gross value added per hour worked. Quali is the quality adjusted labour input measure.
The 1% increase in Construction hours worked MFP is very small, but not the decline often claimed for the industry. Table 2 shows four industries had a fall in hours worked MFP since 1995: Mining -28%, Electricity, gas, water -30%, Rental, hiring and real estate services -32%, and Administrative and support services -16%. The three high growth industries were: Agriculture, forestry and fishing 182%, Information media and telecommunications 64%, and Financial and insurance services 63%.
Construction, however, was one of five industries with negative quality adjusted labour input MFP growth, although at -3% it had a much smaller decline than the other industries of Mining -31%, Electricity, gas, water and waste -33%, Rental, hiring and real estate services -36%, and Administrative and support services -25%. This raises the question of why Construction is singled out as the problem industry.
Table 2. Market Sector industries multi-factor productivity change

Capital Productivity
Capital productivity has been falling for both the Market Sector and Construction since the early 2000s. This is a complex measure, because estimating the stock of capital requires an estimate of annual capital investment and a depreciation rate to account for declining efficiency of the existing stock due to use and age. Although Construction capital productivity peaked in the mid 2000s and declined during the mining boom, the post-boom fall in MFP was due to the sharp decline in capital productivity, because since then labour productivity was more or less flat but capital productivity was falling. As Figure 3 shows the Market Sector also had declining capital productivity, but after 2015-16 the decline in Construction capital productivity was much worse.
Figure 3. Market Sector industries capital productivity
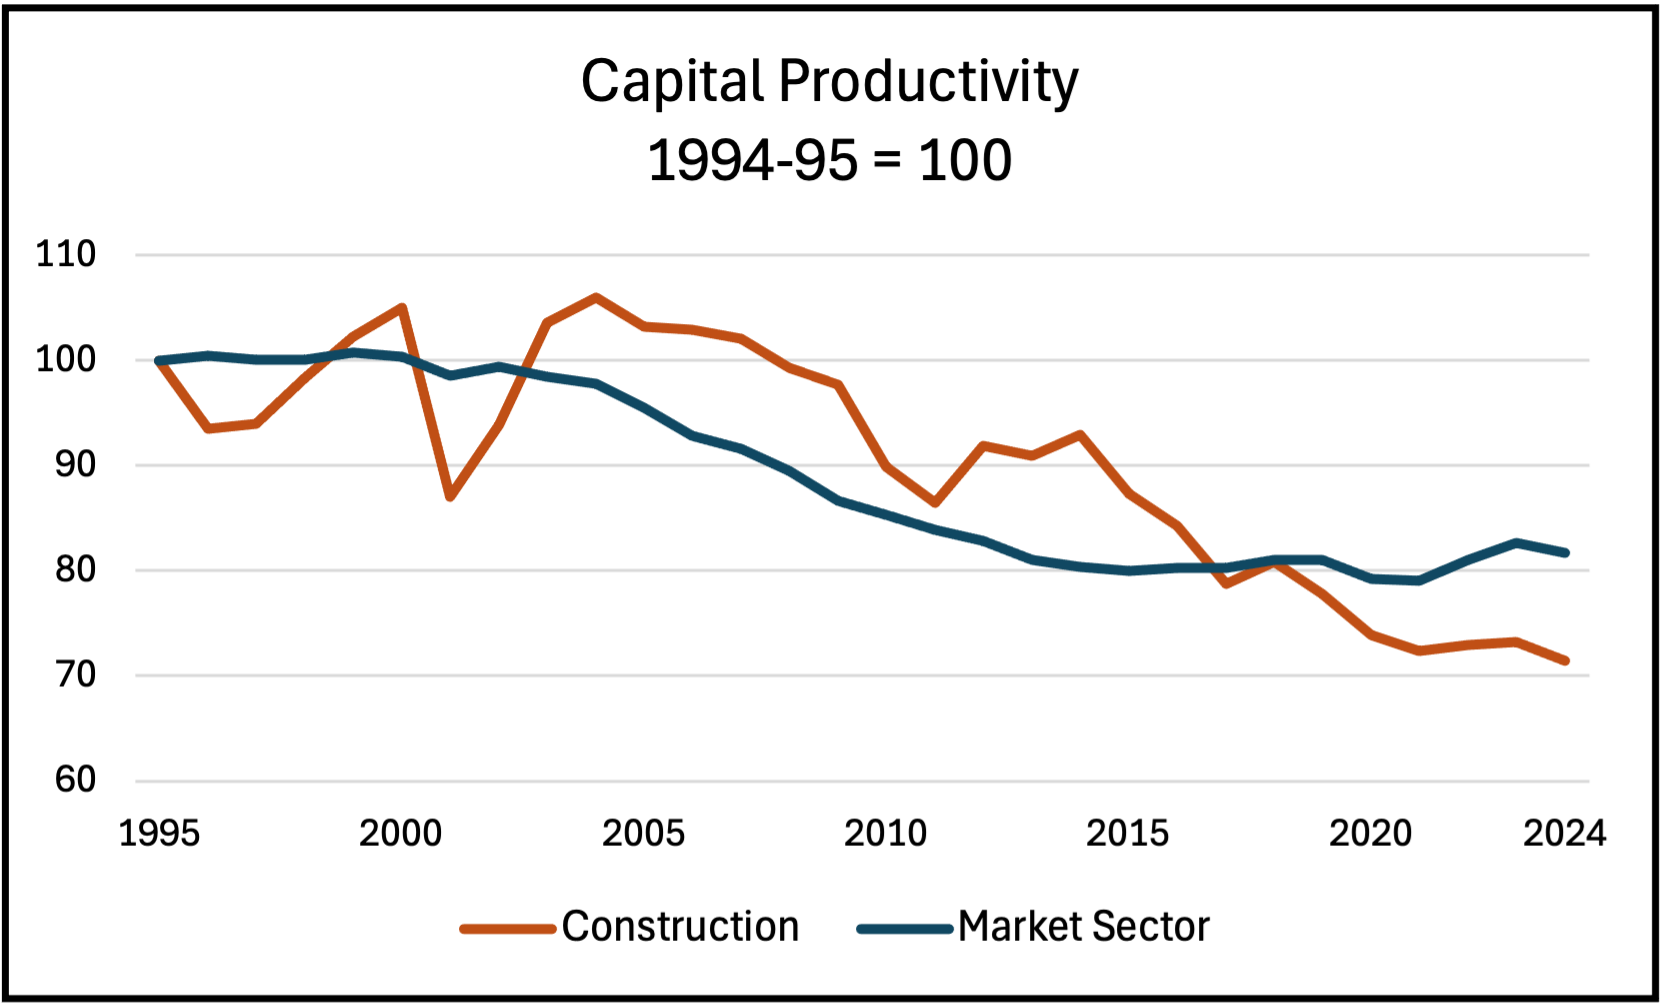
Source: ABS 5260.
What these long run graphs show is that there was a downward shift in Construction productivity around 2015, when both MFP and capital productivity went into significant decline. Up until then Construction productivity had been similar to Market Sector productivity for MFP, but after 2015 the Market Sector and Construction industry measures diverged. The next section looks at productivity over the short run since that divergence.
Productivity Since 2015-16
Labour Productivity
Labour productivity in the short run since 2015-16 has a distinctive and interesting pattern. The hours worked measure has fallen 4% from 100 to 96 but the quality adjusted labour input measure has increased by 6% from 100 to 106, and was in fact higher then both Market Sector measures in 2023-24. The increase in the Quali index occurred in the 2019-20 year with a big jump from 95 to 104, and there has been a gradual increase in the years since.
Figure 4. Market Sector industries labour productivity

Source: ABS 5260. Gross value added per hour worked. Quali is the quality adjusted labour input measure.
The increase in the Construction quality adjusted labour input measure index will be the result of changes in the composition of employment, with the combined share of Professionals and managers increasing from 15% to 18% between 2019 and 2020, and peaking at 19% in 2022. Figure 5 shows the share of Professionals increased from 4% to 6% in 2020, and for Managers the share rose rom 10% to 12% in 2020 and was 13% from 2021 to 2023. In 2024 Technicians and trades workers were 50% of Construction employment, and Machinery operators another 6%, and their combined shares in total Construction employment have decreased by 3% since 2016. The share of Clerical and administrative workers has also declined, by 0.6%. Therefore, since 2016 the overall makeup of Construction workforce has become more skilled and qualified, raising the quality adjusted labour input measures [2].
Figure 5. Share of total Construction employment

Source: ABS 6291
Between 2016 and 2024 there were large differences in the productivity performance of the 16 Market Sector industries. As Table 3 shows, on the labour productivity hours worked basis there were two industries with high growth: Agriculture, forestry and fishing 44%, and Information media and telecommunications 40%. Four industries had growth between 10 and 20%, and five had growth less than 10%. Construction -4% was one of five industries with negative growth, the others were Mining -15%, Manufacturing -4%, Electricity, gas, water and waste -15%, and Financial and insurance services -4%.
On a quality adjusted basis Construction was the only industry to improve on the hours worked measure, all other industries had slightly lower quality adjusted labour input growth than hours worked. The other four industries with negative hours worked labour productivity again had negative quality adjusted labour input labour productivity growth. There were only six industries with better quality adjusted labour productivity growth than Construction’s 6%: Agriculture, forestry and fishing 41%, Wholesale trade 7%, Accommodation and food services 8%, Information media and telecommunications 33%, Professional, technical and scientific services 14% and Administrative and support services 12%.
Table 3. Market Sector industries labour productivity change

Multi-factor Productivity
The MFP indexes for Construction do not show the same pattern as labour productivity. Both the hours worked and the quality adjusted indexes have fallen since 2016 and have closely followed each other down, ending at 92 and 91 respectively in 2024. However, the Market Sector has not performed particularly well, with the quality index only increasing to 101 and the hours worked index increasing to 104.
Figure 6. Multi-factor productivity

Source: ABS 5260. Gross value added per hour worked. Quali is the quality adjusted labour input measure.
MFP growth since 2016 is similar to labour productivity with a couple of exceptions. Table 4 shows on the hours worked measure only Agriculture, forestry and fishing 44% had high growth, and there were three industries above 10%. Five industries had negative growth: Construction -8%, Mining -3%, Manufacturing -1%, Electricity, gas, water and waste -15%, and Arts and recreation services -1%. Again, the growth in the quality adjusted labour input measure was lower than for hours worked, with Construction -9% one of eight industries with declining productivity, including Mining -3%, Manufacturing -3%, Electricity, gas, water and waste -16%. Transport, postal and warehousing -3%, Rental, hiring and real estate services -1%, and Arts and recreation services -3%.
Table 4. Market Sector industries multi-factor productivity change

Capital Productivity
The performance of capital productivity has been particularly poor for construction, falling from 100 to 85 between 2016 and 2024, while the market sector index barely increased and ended at 103.
Figure 7. Capital productivity

Source: ABS 5260.
Misunderstanding Productivity
There are two common misunderstandings about Construction productivity. One is that increasing offsite manufacturing and use of modern methods of construction like prefabrication and modular buildings will increase measured Construction productivity. It will not, because that work will be included by the ABS in the Manufacturing industry subdivisions of Prefabricated steel and timber buildings, Concrete products, and Structural steel. In fact, one reason for the lack of growth in measured Construction productivity has been the gradual but continual shift to more prefabrication and offsite manufacture.
A second misconception is that improving Construction productivity will somehow decrease the cost and increase the number of dwellings being built. This mistakes new construction for the market for housing, where in the short-run price is determined by the interplay of demand and an inelastic supply of new dwellings due to limited industry capacity to build and lengthy approval times. Increasing onsite productivity might decrease the time to complete a build but will have a marginal effect on the total cost of delivery, and the number of dwellings built is determined by project feasibility (i.e. the profitability of development) at any one time. Improving Construction productivity might help, but on its own cannot and will not solve the housing crisis.
Conclusion
That the Construction industry has had no or negative productivity growth for the last few decades has been repeated so many times by so many commentators it has become an accepted fact about the industry. There are, however, four different measures of productivity, and commentators can focus on those that support their claims, and productivity growth rates vary considerably over different time periods, allowing selective choosing of comparisons.
The four productivity measures are labour productivity on an hours worked basis or quality adjusted labour input basis, and multi-factor productivity (MFP includes the capital stock) also on an hours worked basis or quality adjusted labour input basis. The ABS productivity statistics for the Market sector go back to 1994-95, and this analysis has been for two periods, the long-run from1994-95 to 2023-24 (the latest data) and the short-run period of 2015-16 to 2023-24, chosen because 2015-16 was the end of the rapid rise and fall in Construction productivity during the mining boom.
When the productivity of Construction is compared to the Market sector, despite claims that there has been no growth in Construction labour productivity, there has been an increase. Since 1994-95 Construction labour productivity has increased by 17% on an hours worked basis and 24% on the quality adjusted labour input basis which, although less than the Market Sector’s 64% and 41% respectively, is not nothing. Construction is in no way the worst performing industry, although it is far from the level of growth seen in the best performing industries.
In Australia there is a wide difference between a group of high productivity growth industries and a group of low or negative productivity growth industries. On the hours worked measure for labour productivity, since 1994-95 there were three high growth industries, and ehree industries with lower growth than Construction. For quality adjusted labour productivity, Construction had better growth than Rental, hiring and real estate services’ 4%, and there were three industries with negative growth.
For MFP the story is not as good, because since 1994-95 there was only 1% growth in Construction hours worked MFP. That 1% increase in Construction hours worked MFP is very small, but not a decline. Market Sector growth on the hours worked basis was 23%, and on the quality adjusted measure Market Sector growth was 13%. On the hours worked basis there were three high growth industries, and four industries had a decline. Construction was one of five industries with negative quality adjusted labour MFP growth, although at -3% it had a much smaller decline than Mining -31%, Electricity, gas, water and waste -33%, Rental, hiring and real estate services -36%, and Administrative and support services -25%. This raises the question of why Construction is singled out as the problem industry.
Construction capital productivity peaked in the mid 2000s and falling MFP was due to this decline in capital productivity. The Market Sector also had declining capital productivity, but there was a downward shift in Construction productivity around 2015, when both MFP and capital productivity went into significant decline and the Market Sector and Construction industry measures diverged.
There is a notable difference between the quality adjusted labour input measures and the hours worked measures for Construction labour productivity since 2015-16, because the hours worked measure has fallen 4% but the quality adjusted labour input measure has increased by 6%. The increase in the Construction quality adjusted labour input measure index will mainly be the result of changes in the composition of employment, with the combined share of Professionals and Managers increasing from 15% to 19% in 2022. The Construction workforce has become more skilled and qualified, raising the quality adjusted labour input measures.
Between 2016 and 2024 on the labour productivity hours worked basis there were two high growth industries, four industries had growth between 10 and 20%, and five with growth less than 10%. Construction -4% was one of five industries with negative growth, the others were Mining -15%, Manufacturing -4%, Electricity, gas, water and waste -15%, and Financial and insurance services -4%. On a quality adjusted basis Construction was the only industry to improve on the hours worked measure, and there were only six industries with better quality adjusted labour productivity growth than Construction’s 6%.
For MFP growth since 2016 on the hours worked measure only Agriculture, forestry and fishing had high growth, and there were three industries above 10%. Five industries had negative growth: Construction -8%, Mining -3%, Manufacturing -1%, and Electricity, gas, water and waste -15%. Again, the growth in the quality adjusted labour input measure was lower than for hours worked, with Construction -9% one of eight industries with declining productivity, including Mining -3%, Manufacturing -3%, and Electricity, gas, water and waste -16%.
Clearly, Construction is far from the worst performing industry, which raises the question of why it is so often singled out for low productivity growth. There were only six industries with better quality adjusted labour productivity growth than Construction. And are industries that have had declining productivity like Mining or Electricity, gas, water and waste not important? Should their productivity performance not be scrutinised?
Maybe Construction could do better, but there have only been a few high growth industries in Australia over recent decades. Construction is one of a group of low growth industries, and compared to those industries its performance has been much better in both the long and the short-run. Instead of complaining about low productivity growth, attention should be focused on addressing the issues that have negatively affected Construction productivity, such as the number of micro and small firms, lack of standardisation of structural elements, the low level of investment in software and capital stock, state based occupational licensing and building codes, procurement methods, financing and project management, and education and training systems [3].
[1] See The long cycle in Australian construction productivity
[2] See The changing composition of construction employment
[3] See Housing productivity report a missed opportunity
Subscribe on Substack here


