Rises in Non-residential and Declines in Residential Construction Labour Productivity
The tools, techniques, components and materials used in modern construction can be seen on every building site. As anyone who works in construction knows, they have greatly increased the productivity of workers, but that increase in productivity cannot be seen in construction statistics. For decades there has been little or no growth in construction productivity as measured by national statistical agencies.
A major problem is the inclusion in Construction sector statistics of residential building, non-residential building and engineering construction. These are three separate industries with significant differences in their characteristics, but statistical classifications group them together despite these differences. For example, non-residential construction uses heavy machinery and equipment and is much more capital intensive than residential building. Most construction productivity research uses this aggregate data for construction because in the statistics published by national statistical agencies data on employment and hours worked at the level of the three industries is missing.
Productivity estimates require both a measure of labour inputs, such as hours worked or people employed, and a measure of output, usually industry value added (the difference between total revenue and total costs) adjusted for changes in prices of materials and labour. That deflated measure of output is known as real construction value added.
The main reason for the low rate of measured productivity growth in construction are the deficiencies found in construction deflators. If real construction value added is underestimated due to the deflators used, construction productivity has also been understated. Thus the graphs of flatlining construction productivity, despite the obvious improvements in materials, tools and techniques over the last few decades.
The major problem is a downward bias to output estimates because there is no adjustment for quality changes in buildings and structures. Also, the application of a single deflator to heterogeneous goods, especially durable goods, overlooks the differences in age and function between different buildings and structures. This problem becomes more severe with long-life assets like buildings and structures.
New Data on US Construction Productivity
Three economists at the US Bureau of Labour Statistics recently published productivity estimates for fourconstruction sub-industries using four different deflators, providing new, high quality estimates of real construction value added per hour worked in these industries, including subcontractor hours. The BLS research improves on previous research by using appropriate output deflators to develop measures of productivity growth, and their measures are more reliable because the deflators are specifically designed for each industry. Their data and analysis is a significant advance on the aggregate construction productivity estimates that people are familiar with. The four industries are:
- industrial building construction
- single-family residential construction
- multiple-family housing construction
- highway, street, and bridge construction
As the figure below shows productivity fell in single-family residential and multiple-family housing construction, but rose in industrial and highway, street, and bridge construction. Between 2007 and 2020 overall productivity was flat because these rises and falls balanced out. Also, 2007 was the peak of a business cycle, followed by a recession from December 2007 to June 2009 that ‘had both immediate and lasting impacts on the construction industries’ as the following figures show.

Two of the four industries show clear and strong productivity growth. Productivity growth in these industries remains positive with subcontractor labour included. Productivity grew fastest in industrial building construction
Labour Productivity in US Construction
The BLS figures below show trends in output, hours worked, and labour productivity for each of the four industries. Importantly, ‘labour hours always include partners and proprietors (P&Ps), who account for almost 20 percent of labour input in construction.’ Because of data limitations, the reference periods of the industries begin at different points. The BLS comments are under each figure. A short discussion on construction deflators follows.
Single-family residential construction

For single-family residential construction labour productivity rose during the 2000-2005 period, primarily driven by a large increase in output. Starting in 2005, output fell through 2009 at a considerably faster rate than hours worked, leading to a sharp decrease in productivity in the period. These years correspond with the collapse of the housing market. Labour productivity grew from 2009 to 2013 but steadily weakened through 2019.
Multiple-family housing construction

Multiple-family housing had large gains in productivity from 1993 to 2007, as output increased faster than hours worked, followed by a sharp decrease in output and a moderate drop in hours worked, leading to decreasing productivity until 2010. From 2010 to 2016, output rebounded substantially, leading to significant productivity growth. However, productivity dipped from 2017 to 2020 due to growth in hours worked outpacing growth in output
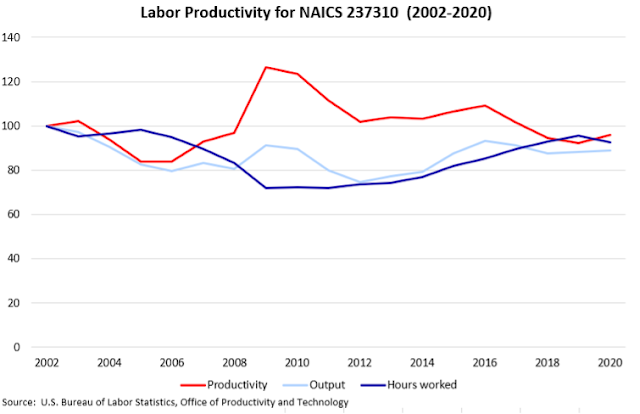
Industrial building construction

For the industrial building construction industry, from 2006 to 2018 the productivity and output indexes rose until 2009, then fell sharply in the 2007-2009 recession, recovered from 2011 to 2015, and then declined again through 2018. The change in hours worked was slow and uneven, but positive over the 2006-2018 period. In 2019, the rising output and falling hours worked series moved in opposite directions, which led to the first gain in productivity since 2015.
Highway, street, and bridge construction
Productivity in the highway, street, and bridge construction industry increased during the 2007-2009 recession. Output rose as hours worked declined during this period. Then, until 2018, productivity fell most years as output saw no net growth while hours worked did. Since 2018, there has been little change to output, hours worked, or productivity.
Construction Productivity
Construction productivity has been notable for its absence for decades. The low rate of growth in Australia, the United Kingdom, the European Union and the United States and elsewhere became an issue in the late 1960s, when declining output per hour worked and output per person employed in the construction industry first attracted attention. The measured rate of growth of productivity of the construction industry since then has been poor even by comparison with a long-run overall industry average in the order of two to three per cent a year. Construction productivity in the US has been falling since the late 1970s, as in the figure below.

Possible reasons for the low growth of construction productivity are many and various. They include the high labour intensity of the residential industry, the number of small firms, few economies of scale in the industry, a lack of competition, regulatory impediments, low R&D, poor innovation and management practices, and a low level of training and skill development. Alternatively, it is possible that the data and methods used to estimate the level of productivity in the industry might be faulty, and we have a false picture of construction productivity.
A second and more technical problem is the method used to adjust industry output for changes in prices of materials and labour to find changes in the quantity of output of completed buildings and structures. This deflation of output is typically done with input price indexes or producer price indexes. The problem with input price indexes is they assume a constant relationship between input and output over time, so there is an assumption of no change in productivity which means that, if productivity is increasing, input price indexes will be upwardly biased.
There is an extensive literature on deflators, the problems of deflation, and the effects on estimates of construction output of commonly used deflators. The issues raised by the use of price indexes for deflation have not been solved to date, and appear to have no simple, or readily available solutions. These include the fact that the deflator used to adjust for price changes will systematically overstate the rate at which prices increase and underestimate growth in output if indices for labour and material costs are used instead of output price indices (which are generally not available). I have a 2001 paper on Construction Deflators and Measurement of Output.
Another problem is the application of a deflators to the diverse range of buildings and structures, and differences in quality and function between them. As the energy efficiency and quality of finishes has improved, and as the share of building costs due to mechanical and electrical services has increased over time (providing greater amenity), the deflators used have not been adjusted to take these trends into account. In effect, the deflators assume there has been no change in the quality of buildings, and their inability to capture quality changes in the buildings and structures delivered by the construction industry has adversely affected the measurement of productivity.
The US Bureau of Labour Statistics recently published productivity estimates for four construction sub-industries used four deflators from different government databases. Their research addresses the problem with new data: ‘The main difficulty is that buildings differ widely in their characteristics and features. Similarly, the nature of the underlying terrain varies widely among construction projects. Consequently, economists, both in general and within the BLS productivity program, have found it exceptionally difficult to develop reliable output price deflators to convert observed revenues into meaningful measures of output growth over time. Good output price deflators are therefore the key to more accurate measures of productivity growth in construction.’
The researchers say: ‘we examine only those industries in which the deflators exactly match the industry boundaries. Previous work generally looked at the total construction sector. Since the many new deflators now available did not exist then, these prior studies had to use the single-family housing deflator and an associated cost index to deflate production in most or all of construction.’
Leo Sveikauskas, Samuel Rowe, James D. Mildenberger, Jennifer Price, and Arthur Young, "Measuring productivity growth in construction," Monthly Labor Review, U.S. Bureau of Labor Statistics, January 2018, https://doi.org/10.21916/mlr.2018.1.