Showing posts with label construction 4.0. Show all posts

Sunday 18 February 2024

Construction Innovation: Venture Capital and Contech Funding

What do we know given definition and measurement Issues?


Construction is often seen as a low R&D industry, with a low expenditure on R&D to revenue ratio compared to other industries. While that may be true for the many small and medium sized firms that make up the majority of the industry, many of the large firms do invest in R&D. A 2023 McKinsey report on construction technology (Contech) that ‘includes design software, robotics, and tools for the planning, scheduling, budgeting, and performance management of projects’ found USD$50 billion had been invested between 2020 and 2022. Their estimate based on Pitchbook data includes incumbents as well as startups and new entrants.

Incumbents like Project Frog (US), Balfour Beatty (UK) and Mirvac (Australia) have developed platforms, and there are many established offsite manufacturing and modular building Firms. There are partnerships between Trimble and Microsoft and Laing O’Rourke and Lenovo. Other examples are Autodesk’s recent integration of design and manufacturing systems, Skanska embedding wireless sensors in buildings, Holcim’s green cement, ARUP’s data collection systems, remote-controlled excavators from Caterpillar and Komatsu, the Hilti Jaibot, and software from OracleAconex and Procore. There are many more.

As those examples show, contractors are not the only firms doing R&D, so estimates for the industry are unreliable. R&D by professional service firms, and the construction materials, component and equipment manufacturing industries will not be included, although they have been responsible for many technical advances and the introduction of new products and equipment, such as drywall, plastic pipes, excavators, cranes, facades and lifts. This is a well-known problem when measuring construction R&D, and is a result of the industry classification system used by national statistical agencies.

This measurement problem is becoming more acute because, for the construction industry, a cycle of innovation has begun with new entrants attracting substantial R&D investment from outside the industry. Investment in construction R&D and innovation is now coming from private equity and venture capital (VC) funds such as Fifth Wall, Brick & Mortar, WND Ventures, Ironspring, Building Ventures, Dynamo, Foundamental and Australia’s Taronga Ventures.  

How much of the expenditure on R&D by incumbents is likely to be included in VC funding estimates? Although this expenditure should be taken into account for overall industry investment in Contech, many incumbents do not participate in VC. In fact, it is hard if not impossible to get a good estimate of Contech investment because it includes so many different areas associated in some way with the built environment, such as property and real estate, transport, energy and waste management, materials manufacturing and so on. Then there are areas associated with decarbonisation, such as measuring embodied carbon, the energy transition, retrofitting buildings etc. How to draw a boundary around such diverse topics is a major issue.

The table below demonstrates the extent of the measurement problem. It collects the latest estimates and total investment from the three sources reviewed in this post for the different time periods they cover, plus the 2023 McKinsey report that was not restricted to VC funding. There are a few key points to note. First, there are similar trends in their data with considerable variation but, second, wide differences are seen in the yearly figures, and third, the totals indicate significant cumulative investment.

Comparing the Foundamental ($25.4bn) and Kabri ($22.4bn) data for the same time period of 2017 to 2022 as McKinsey ($77bn), there may be something like a 60/40 split between VC and incumbent funding of Contech. That can only be a guesstimate because of the different sources used and the severe definitional and boundary issues around what is and is not included in these estimates of Contech.


Table 1. Estimates of Contech VC funding by year and totals USD$billion


This significant level of VC investment is a new development, before 2017 there was little interest in construction innovation from investors. Then a Californian start-up called Katerra reached a USD$1 billion valuation in 2017 followed by a $865mn investment in 2018 from Softbank. The company’s goal was complete vertical integration of design and construction, building factories to manufacturing cross laminated timber panels and then delivering and assembling the building onsite. Over five years Katerra went through four different business models as they sought to achieve sufficient scale to keep their factories busy, but in June 2021 filed for Chapter 11 bankruptcy and the factories were sold. The Katerra story was covered in a previous post here

Despite the failure of Katerra, and many other firms attempting to make the economics of manufactured housing work, there has been a rapid increase in VC investment in Contech since 2018. Venture capital funding is a significant metric because investment in startups is a proxy for innovation, and the development of IP and other forms of intangible capital. This post looks at three recent reports on VC investment in Contech.


Cemex Ventures Top 50

In January Cemex Ventures released their Top 50 Contech Startups 2024, the 5th edition of their Top 50 list. Cemex Ventures is the VC and innovation unit of Cemex, a global supplier of building materials. The 2019, 2020 and 2021 reports were only lists of companies, but the 2022 and 2023 reports have VC totals and other details like deal size and numbers. The source of their data is the Traxn VC database.

Their estimate for 2023 is USD$3.03bn, compared to $5.38bn in 2022, significantly higher than the Foundamental estimates below, particularly for 2023, no doubt due to differences in their data sets. Cemex found half (49.5%) was in initial seed rounds for early stage startups, and 23.3% was for Series A funding rounds for more mature companies. In 2023 nearly 90% of funding went to the US (44%) Canada (11%) and Europe (32%, including the UK with almost 10%).

Cemex Ventures divided funding into four ‘focus areas’:

  1. Green Construction: Processes, products and services that offset negative environmental impacts raised $1.06bn.

  2. Enhanced Productivity: Digital solutions aimed to increase efficiency through technical, data-driven solutions got $701mn.

  3. Future of Construction: AI, robotics and industrialized construction like 3D printing, BIM and autonomous equipment raised $690mn.

  4. Construction Supply Chain: Technologies that secure or track materials and fleets, manage builders’ inventories and material marketplaces got $584mn.


Figure 1. Four focus area


There is also 2023 data on a number of specific ‘topics’, which are more specific areas of interest.


Figure 2. Specific Contech topics


Where to draw the boundaries around the many and diverse areas of Contech, and how to define those areas, is an important issue because it should be possible to separate different topics or areas, for example Contech from Proptech and carbon accounting from energy efficiency. The Cemex Ventures division into four topics is a good place to start.


Foundamental

Another Contech VC estimate came from Foundamental, which found over USD$30bn was invested in Contech between 2014 and 2023. Their estimate for 2021 was $8.7bn, followed by $4.9bn in 2022, falling to $1.3bn in 2023. Figure 3 shows their data, where they have separated funding for Katerra.


Figure 3. Construction technology funding


 Source


The database Foundamental used is from Wallhack, an open source provider of VC investment in AEC-Tech and ConTech. They provide this explanation:

AEC-Tech contains pure Construction-Tech, but includes more. It is about fixing the building-world. In our definition, besides construction-tech, AEC-Tech also contains design solutions that also help architects and engineers, supply chain solutions that fix problems in the building world, solutions that help with the retrofitting of buildings and infrastructure, and fixes for skilled labor/blue-collar work and installers. It does NOT, however, include building operation, which would often be called Prop-Tech.

There are over 700 companies in the dataset, many of which have less than 10% of their portfolios invested in AEC-Tech. A group of ‘building world specialists’ can be selected. How these ‘building world specialists’ are differentiated from the broader AEC-Tech investors is not clear. This list has 81 companies, with the percentage of their portfolios invested in AEC-Tech ranging between 30% and 100%. Total investment in this group of companies is USD$42.4bn.

The start-ups included in these estimates of VC funding are by definition technology leaders, pushing at the technological frontier through experimentation and development. Frontier firms bring with them radical new production technologies. While these firms are new entrants, some incumbents are also on the frontier. Cemex is not the only incumbent investing in Contech VC, the Wallhack list also includes Bentley, Trimble, Autodesk, CRH and Suffolk among others. There are others not included, like Vinci with their Leonard fund.


Kabri Construction Research

Research by Kabri Construction Research referenced here used publicly available information and they note, as a result, it will underestimate both the number of startups and the amount raised. Kabri found 300 construction startups up to 2022. Their estimate for 2022 is USD$8.9bn, and for 2021 was $5.5bn.


Figure 4. Contech funding


Kabri divided the startups into 13 categories, explained as:

  1. Builders/Developers - Startups that are tackling the entire process of constructing a building, either as a builder or as a builder+developer. Many of these startups use prefabricated or modular construction to try to improve the process. Others such as Homebound, are focusing on improving the building experience with software. These startups are almost uniformly devoted towards residential construction. Examples: VeevBlokablePrescient

  2. Building Materials - Startups trying to develop new types of building materials. This includes things like low-carbon concrete, drywall alternatives, and smart glass. This category also includes what we might call ‘low level components’ - things that we might consider ‘simple parts’ rather than raw materials, such as BAMCore. Examples: ViewCarbicreteElectrasteel

  3. ADUs/Office Pods - Companies trying to sell small backyard homes or office units. Examples: CoverAdobuBoxabl

  4. Energy Use and Management - Startups aimed at improving building energy use. This includes companies like BlocPower (finances and install energy efficiency upgrades), as well as companies like BrainBox AI (which makes software to try to optimize HVAC use.) It also includes startups like Intellihot, which make more efficient water heaters. Examples: RedaptiveDandelion EnergyDomatic

  5. Marketplaces - Startups trying to connect the large number of buyers, sellers, and transaction parties that exist in the hugely fragmented construction industry. These range from workforce sourcing companies like Workrise, to construction equipment marketplaces like EquipmentShare, to companies that help homeowners find renovation contractors like Sweeten. Examples: AmastBuildZoom

  6. Distribution and Logistics - Startups trying to tackle the problem of getting building materials to the jobsite. Examples: RenoRunTulInfra.Market

  7. Construction Management Software - Startups that make software for jobsite coordination, progress tracking, task and document management, and other similar tasks. Examples: ProcoreFieldwireRedTeam

  8. Robotics - Startups trying to find ways to introduce robots onto the jobsite, or in other parts of the construction value chain. Examples: DustyCanvasToggle

  9. 3D Printing - Companies trying to use scaled-up 3D printing technology to fabricate entire buildings or building components. Examples: IconMighty BuildingsBranch Technology

  10. Fintech - Companies trying to improve the financial plumbing that the construction process uses. Examples: Built TechnologiesRigor.buildLevelset

  11. Datacapture and Digital Twins - Companies using some combination of drones, 360 degree cameras, hardhat mounted cameras, and other sensors to record and analyze jobsite data and track construction progress. Often utilize computer vision and machine learning techniques to process this data. Examples: OpenSpace.AIDoxel.AIVersatile

  12. Renovation/Repair/Maintenance - Companies trying to improve the process of maintaining a building. These range from software companies who offer maintenance subscriptions, to products that can monitor and report water usage and leaks, to companies that make bathroom renovation easier. Examples: Humming HomesBlock RenovationMade Renovation

  13. Other - Everything else that doesn’t fit into one of the above categories. This includes AR/VR startups, companies that make AEC design tools, companies that make software to streamline one particular workflow (what we might call “excel replacements”), construction insurance companies, and anything else that doesn’t fit into one of the above. Examples: UpCodesToricShepherd


Table 2. Funding by category


The post on Kabri concluded with some important points. First, ‘many, perhaps most, innovative building products don’t seem to come out of startups – they’re either small-scale developments from companies that don’t obtain VC … products from large, established suppliers … or from academia’. Second, a few companies have taken the bulk of investment. The top three categories in Table 2 ‘account for more than 50% of construction startup funding. Within each category a single company (Equipmentshare, Katerra and View respectively) accounts for 50-60% of total funding’. Note that Katerra and View have both failed.


Conclusion

Measurement problems are not a new issue in construction, productivity being the prime example. Even so, getting a clear picture of R&D and innovation investment in Contech is particularly challenging. Reports on VC funding come and go, covering different time periods and geographical areas, making comparisons difficult. The Cemex Ventures Top 50 reports for the last two years have annual total funding data included, and if they continue their reports that would be a set of consistent data. Foundamental may also keep their annual data updated, although they only have a grand total and do not have categories or topics.

As well as regular annual data some way of organising it is necessary. The Cemex four topics are probably too broad, while Kabri’s 13 may be too many. Somewhere in the middle would be a useful way of categorising the very diverse range of areas generally accepted as included in Contech. Kabri drew the boundary around things that could not be moved from a building, but included Building maintenance and management and Fintech companies. As Kabri note, including a startup in Contech is often a judgement call because their hardware or software can be used in other industries, drones are a good example.

The project delivery approach taken by Foundamental and McKinsey seems appropriate. This focuses on technology that in some way will (might) improve project creation and delivery, which is the traditional domain of the construction industry. It means property and real estate tech is excluded, but more controversially climate related tech too. That is an important omission because climate change is (IMO) the single biggest issue. However, given the number and variety of climate related tech startups this can be usefully considered a category of its own.

Many startups fail, and usually VC spreads its bets to manage the risk. Contech seems different, the bets are concentrated in construction or related built environment industries. Many funds in the databases used in the reports discussed here seem to be concentrated, with a small number of investments. Some of the biggest bets have already failed. Even Procore, seen as a Contech success story, is finding profitability hard to achieve Finally, there is a very large number of small Contech startups covering a wide range of topics. Unfortunately, numbers and diversity may not lead to success because fragmentation makes achieving scale more difficult, and consolidation only starts to happen when successful innovators emerge.


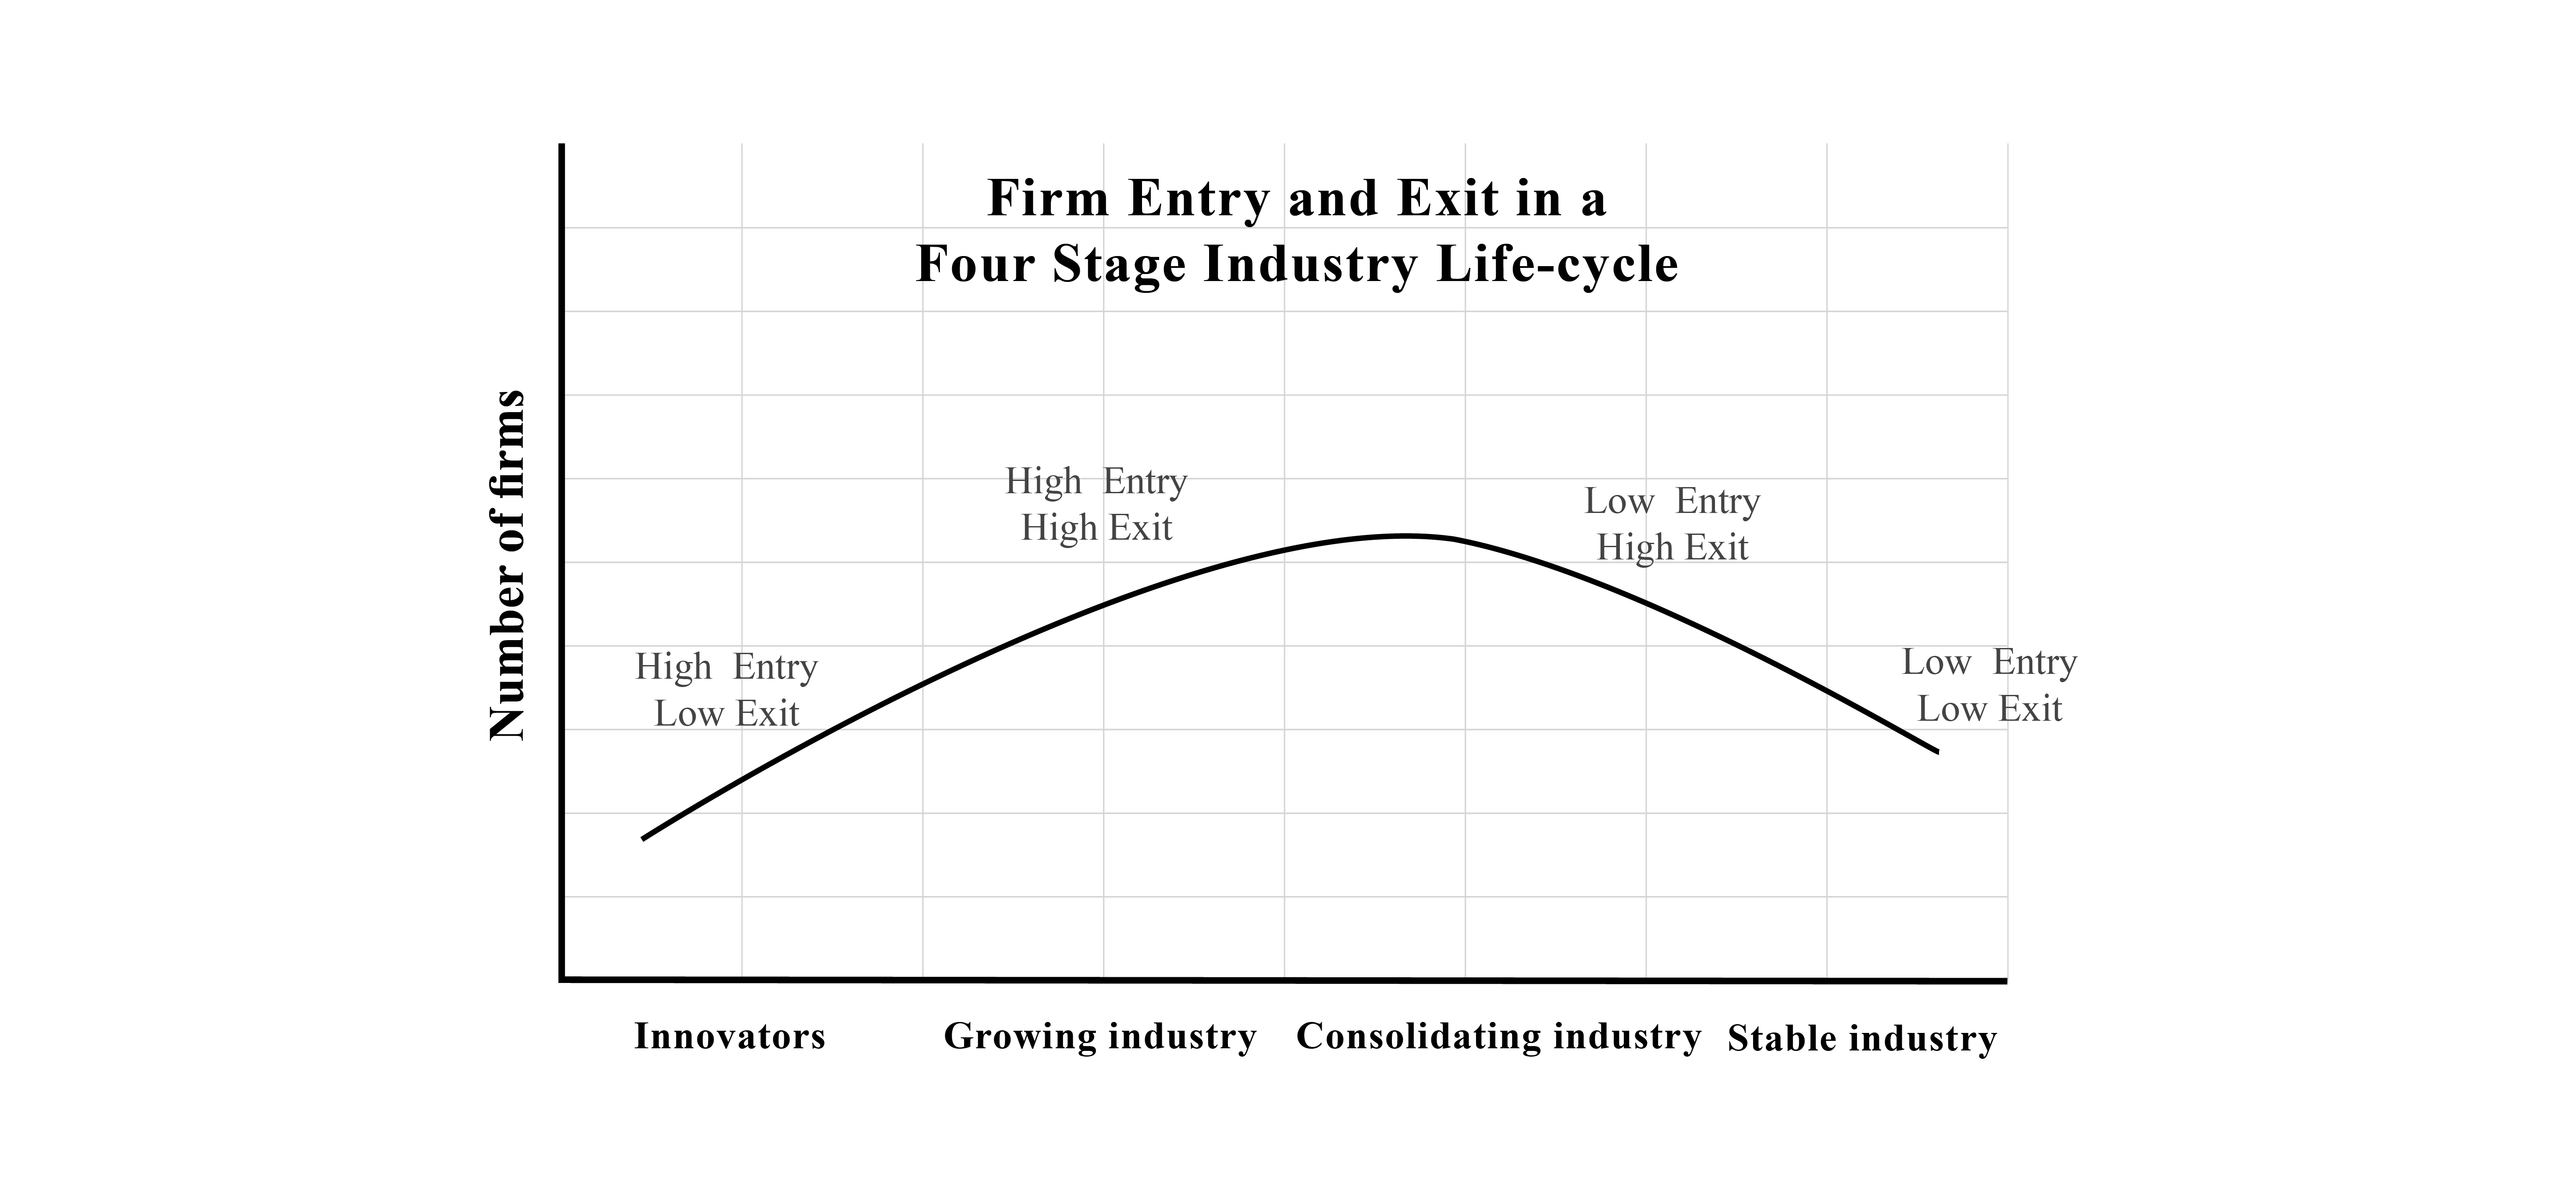
Figure 5. Innovation and Industry Structure


Saturday 8 July 2023

Australian Manufacturing of Prefabricated Buildings and Construction Products

 The extent of prefabrication used in Australian construction is unknown and unknowable


The Australian construction industry is supplied by an extensive manufacturing base that includes a wide and varied range of industries, producing machinery and equipment as well as materials like bricks, glass, concrete, steel and wood. In 2021-22 there were 133,216 people employed in construction related manufacturing in Australia.


The Australian Bureau of Statistics also includes prefabricated buildings in manufacturing, however, the data is limited to the relatively small number of firms that classify themselves as prefab manufacturers, and misses offsite work by firms that may be classified as building or trade contractors, architectural or engineering practices, or work done inhouse in other industries like tourism and aged care.  


Therefore, the actual extent and depth of prefabrication used in Australian construction is unknown, and with the data available is largely unknowable. With offsite manufacturing in general, and prefabrication in particular, seen as important to addressing the industry challenges of sustainability, productivity and skills, the lack of data on how many and what type of prefabricated buildings and components are produced each year in Australia is a significant gap in knowledge and understanding of the industry.


This research starts with the ABS Manufacturing industry data. It then looks at their estimates of the number of dwellings on manufactured home estates and the effects of misclassification on those estimates. The next question addressed is the number and type of firms producing prefabricated buildings. 


Construction Related Manufacturing


Australian Manufacturing is divided by the ABS into 19 subdivisions, with the subdivisions made up of groups of firms classified by similarities in their products or processes into classes. The ABS gives an industry class an ANZSIC four digit number, and that level of detail allows an estimate of the employment and output of construction related manufacturing to be made. The data comes from the ABS annual publication Australian Industry.


The largest of the relevant classes are for widely used materials like wood, concrete, steel and glass. Other classes include manufactured products like plaster and ventilation systems. Table 1 shows the industry classes identified as directly contributing to new construction, with the number of people employed in June, and in Table 2 their output as Industry value added (IVA) in current dollars. Figure 1 shows the totals.


Figure 1. Total employment and output


In 2021-22 construction related manufacturing was 16% of total manufacturing IVA and employment, having increased from 15% in 2014-15.


Firms self-select the ANZSIC industry code used to classify them into an industry class. Some building companies like Sekisui Australia, Hickory and Hutchinson have offsite facilities but are not manufacturers. A smaller builder that does some modular or offsite construction might be classed as a building contractor or a construction trade such as Carpentry services. Prefabricated buildings produced inhouse by an organisation in an industry like transport, tourism or retirement villages will not be included in manufacturing. 


Therefore, there is some give and take as regards to what is included in and excluded from these industries, an outcome of the ANZSIC classification system. Some building products are not included, like floorboards, carpets and insulation, because they belong to larger product groups and can’t be separated in the data. On the other hand, industries included here like Glass products and Paint and coatings supply a range of other industries besides construction.  


The four largest manufacturing industries supplying construction add up to nearly 75,000 people employed producing over $8 billion in added value in 2021-22, in Table 3. 


Prefabricated Buildings and Concrete


There are two industries producing prefabricated buildings, of wood and metal respectively. These have grown significantly since 2014, although the big jump in IVA in 2022 may be revised in next year’s release. Nearly 10,000 people produce wood and steel prefabricated buildings. The ABS does not have data on what types of buildings are produced (i.e. residential, commercial, institutional etc.). Wooden building prefab is a very small industry, in 2021-22 total income was only $688 million and IVA was $251mn, compared to prefab steel building with income of $3.5 billion and an IVA over $1.1bn. 


Concrete product manufacturing employed 7,670 people, a substantial industry that produces pots and bricks, but also prefabricated elements and buildings. The precast concrete industry is highly concentrated, with six major firms (ADBRI, Brickworks, CSR, CTC Precast, James Hardie, Holcim) and a large number of small and medium size firms around the country. 


The combined total of offsite construction in 2021-22 was over 17,000 people employed and an IVA of $2.4 billion. 


The share of wood and steel prefabricated buildings in total construction related manufacturing (in Figure 2) increased by nearly half between 2014-15 and 2021-22. This may be the strongest signal in this data of the uptake of modern methods of construction and increasing use of offsite construction. 


Figure 2. Wood and steel building’s share of total construction related manufacturing


How Many Manufactured Homes?


The 2021 ABS Housing Census dwelling location data includes manufactured home estates and long term residents in caravan parks, and there were over 10,000 of these manufactured houses in Australia, and another 2,000 townhouses and apartments (Table 5). Unfortunately, the 2016 Census housing data did not include this category. The ABS had a separate category for Retirement villages in the 2021 Census, with over 200,000 dwellings included. An unknown proportion of those retirement villages are manufactured housing. 


The ABS website explains their methods:

Dwelling location data was recorded by ABS Address Canvassing Officers in the lead up to the 2016 Census as a once-off part of establishing the Address Register as a mail-out frame for designated areas. Dwelling location was also verified or collected by ABS Field Officers during the 2016 and 2021 Census collection periods.


In rare cases, an establishment may fall into more than one category of dwelling location, such as a retirement village that contains manufactured homes, or a residential park that is made up of a mixture of caravans and manufactured homes. However, a dwelling can only be allocated to a single category and in these cases a determination was made during Census processing of the most appropriate category for the dwellings in question. 


And therein lies the problem, manufactured homes that are not on an estate but within a retirement village. Research on ABS data on retirement villages and manufactured housing estates (MHEs) by Lois Towart found that compared to the 2016 Census “the 2021 Census is significantly more accurate in identifying and recording retirement villages. The issue is the numbers of caravan parks and MHEs that are recorded as retirement villages. This overstates both the size of the sector and the population.” 


In her study of 112 retirement villages and 101 caravan parks and MHEs in the Central Coast, Newcastle and Hunter regions in NSW, individual properties were reconciled with small area (SA1) ABS Census data for the 2021 Census. “These are retiree destinations with large numbers of retirement villages and MHEs operated as retirement living’ and “examination of classification by the ABS demonstrates that for the 2021 Census when the dwelling location for caravan parks, MHEs and retirement villages is combined, then the total population is relatively accurate. The inaccuracy is the recording of caravan parks and MHEs as retirement villages.” 


How large is this problem? The Census data in Towart’s research has the total number of people living in retirement villages in 2011, 2016 and 2021 as 154,579, then 205,709, and in 2021 249,262. That increase of almost 100,000 people implies at least another 50,000 dwellings, and probably more than 60,000 given the age of this population. An unknown number of those new dwellings were prefabricated. 


Some retirement village operators offer sites for relocatable homes, but these will not be classified as MHEs. The construction methods some others use will be based on prefabricated pods and modules, probably sourced locally from a small company. Much of this offsite production might be done by firms not classified as manufacturing buildings. 


How Many Producers of Prefabricated Buildings Are There?


The membership directory of prefabAus lists 9 companies as ‘end-to-end modular’ builders, and there are a dozen other member companies that produce prefabricated buildings or modules. Adding results from other web searches gives a list of 39 companies:

Anchor Homes

Archiblox 

Arkit

Ausco Modular Construction 

Black Diamond Modular Buildings

Carbonlite

Cubehaus

Ecoshelta

Ecoliv buildings

Ehabitat

Fairweather Homes 

Fleetwood Australia

Harwyn

Hickory Group

Hutchinson Builders

Hunter Valley Modular Homes

Habitech Systems

Intermode

K.L. Modular Systems 

Landmark Products 

Maap House

Marathon Modular

Mode Homes

Modscape

Parkwood

Prebuilt Commercial

Pretect

PT Blink

Shawood by Sekisui House

Spanbilt Pty Limited

Strine Environments 

Strongbuild Manufacturing

Sumitomo Forestry Australia

Swan Hill Engineering

Uniplan Group

Valley Workshop 

Volo Modular

XLam

Zen Architects


In this (undoubtedly) incomplete list there are substantial companies like Ausco, Modscape and Prebuilt, but many are small firms. Several are engineering and architectural practices that would not be classified as manufacturers. Included are large building contractors like Hickory and Hutchinson, developers like Sekisui and Parkwood, and corporates like Strongbuild and Sumitomo. XLam manufactures cross laminated timber, PT Blink has a design for manufacture and assembly (DfMA) platform. There are also firms that specialise in prefab school buildings, like Marathon, Pretect and Harwyn.


Overall it looks like a fragmented market with a few major firms and a large number of small producers, specialised by type of material and type of building produced. Because of transport costs and marketing reach, many producers would be expected to be local and focus on a region. 


The diversity of firms in this list highlights the difficulty the ABS would face in measuring the prefabricated building industry. As well as manufacturing, other ANZSIC industries they come from are construction, professional services and business services. With the ABS moving away from surveys to digital data, this sort of detailed data spread across a number of industries is hard to collect. Then there is the question of defining what is prefab and modular construction, which would be needed to organise any data collected and estimate how much is being produced. 


Deloitte 2023 Industry Survey 


Another piece of information comes from the Deloitte Access Economics 2023 State of Digital Adoption in Construction Report, which found 34% of the 229 firms in their survey used prefab and modular construction. The survey sample was from Australia (132), Singapore (38 firms) and Japan (59 firms), and the firms were from Building and construction (144), Architecture (86), Engineering (79) and Other (65). 


The survey ranked 16 digital technologies with BIM, construction management cloud software and drones used by around 40% of firm the leaders, followed by prefab and modular where, of the 229 firms, 34% are using it already and 28% are planning to in the future. The remaining 38% are not intending to use it. 


That means 76 of the 229 firms use prefab, and its possible that many of them are in the Building and construction category, which would mean up to half of the 144 firms in that category are using prefab and modular. An unknown proportion of those firms are Japanese and Singaporean, where the use of prefab and modular has been supported by government policy and is more extensive than in Australia. 


The report included a few more data points:

·      ‘Larger businesses in the survey used significantly more technologies on average, with businesses that have more than 500 employees using an average of seven different technologies, compared with four technologies for those with fewer than 500 employees.’  

·      Businesses used five of the 16 technologies on average, and about 10% were using more than ten different technologies.

·      Newer businesses are investing in new technologies, with ‘businesses less than 10 years old investing 80% more than those in operation for 20 years or more.’


The survey does not allow much beyond reinforcing the generalisation that large companies, particularly building contractors, are more likely to be using prefab and modular construction. 


Conclusion


Construction related manufacturing is a significant part of Australian manufacturing, and its share of total manufacturing employment and IVA has increased from 15% in 2014-15 to 16% in 2021-22. There are 17 ANZSIC industry classes included in construction related manufacturing, using data from the Australian Bureau of Statistics annual publication Australian Industry 


The two industry classes for prefabricated buildings are relatively small, but have had rapid recent growth. The share of the combined wood and metal prefabricated building classes in total construction related manufacturing increased by nearly half between 2014-15 and 2021-22. However, wooden building prefab is a very small industry, employing 1,253 people in 2021-21, compared to prefab metal building with 8,144 people employed. The ABS does not have data on what types of buildings are produced (i.e. residential, commercial, mining, institutional etc.). 


The ABS 2021 Housing Census found 10,000 manufactured houses in Australia, and another 2,000 townhouses and apartments . This does not include the 200,000 dwellings ABS has in a separate category for Retirement villages. An unknown proportion of those retirement villages are manufactured housing. 


The ABS data also does not include offsite work done by firms classified as building or trade contractors, architectural or engineering practices, or work done inhouse in industries like transport, tourism and aged care. The problem the ABS would have measuring the prefabricated building industry is that the ANZSIC industries firms involved come from include manufacturing, construction, professional services and business services, and this sort of detailed data spread across different industries is hard to collect.


A list of 39 firms producing prefab and modular buildings was compiled from prefabAUS members and web pages. This appears to be a market with few major firms and a large number of small local producers, specialised by type of material and type of building produced. The industries they come from include engineering and architectural practices, building contractors, and corporates, and any modules or buildings these firms produce will not be found in the ABS manufacturing statistics. This is not a criticism of the ABS, it is an outcome of the classification system used internationally for industry data. 


The extent and scale of prefabrication used in Australian construction is unknown, and currently is unknowable. Based on available evidence it is mainly used in specific sectors like the mining industry, education, low cost housing, aged care and retirement villages. There is no evidence that it is cost competitive with conventional construction methods for the great majority of projects. This may be because prefab is a developing industry, or because economies of scale are not as great as expected. 


With offsite manufacturing in general, and prefabrication in particular, being seen as important to addressing the industry challenges of sustainability, productivity and skills, this lack of data is regrettable, and the lack of data on how many and what type of prefabricated buildings and components are produced each year in Australia is a problem if an objective of industry policy is to increase the use of prefab and modular construction.