Employment Increases as Work Done Falls
The number of people employed in construction is at record highs. In the ABS Labour Account for June 2023 there were 1,268,472 people employed, an increase of 135,693 people since 2018, the most recent peak in the volume of work done. There is only a weak relationship between changes in the volume of construction work done and the number of people employed in construction, as Figure 1 shows, employment typically rises or falls by one or two percent a year while the annual volume of work done has changed by more than five percent in nine of the 15 years between 2007 and 2022.
Figure 1. Construction work done and people employed

Note: The number of people employed includes all workers in June each year, and comes from ABS Australian Industry. The volume of work done is from the ABS chain volume Value of Construction Work Done, which is expenditure on construction adjusted for inflation.
Figure 1 also shows that, from 2007 to 2010, while the volume of work done was increasing the number of people employed barely changed (by 3,000 people). The 2011 bump in employment was due to increased Construction services employment in public building work done as part of the fiscal response to the financial crisis, and the following year employment fell by half the increase of 2011. The increase in work done in 2012 and 2013 was due to the doubling of Engineering work during the mining boom, which went from $76 billion in 2007 to $158bn in 2013, before falling below $100bn in 2017. The $94bn of engineering work done in 2022 was mainly infrastructure projects in transport and energy. The increase in Construction employment in 2017 and 2018 followed rising residential building, when employment in Construction services also began to increase, and in 2022 there was a total of 1,253,906 people employed in construction, an increase of 121,172 since 2018.
There have been significant changes in both employment and the volume of work done at the subsector level since 2011 that are not reflected in the industry’s total work done or total employment, and a more detailed picture emerges when construction employment in the three industry subsectors of Engineering, Building and Construction services is used, and construction work done is divided into engineering work and building work. There is a clear relationship between changes in engineering work done and Engineering employment, and in building work done and employment in Building. When the recent cycles in engineering and building construction are taken into account there are significant differences between the industry subsectors, and a comparison of changes in construction employment and work done since 2007 is below in Table 1, divided inro trough-to-peak and peak-to-2022 time periods. Between 2007 and 2022 the volume of engineering work done rose by 23 percent but the number of people employed by 51 percent and, for Building, work done rose by 36 percent and the number of people employed by 46 percent. Construction services employment rose by 26 percent, less than the 36 percent increase in building work done.
Table 1. Changes in work done and employment 2007-2022
Industry | Work done | Employed people | |
Engineering Construction | 2007-13 2018-22 2007-22 | 107% -20% 23% | 76% 2% 51% |
Building Construction | 2013-18 2018-22 2007-22 | 29% -3% 36% | 27% 7% 46% |
Construction Services | 2013-18 2018-22 2007-22 | 29% -3% 36% | 9% 11% 19% |
All Construction | 2013-18 2018-22 2007-22 | -4% -11% 29% | 6% 11% 26% |
Note: Engineering employment and engineering construction. Building and Construction Services and building work done.
The long-run averages used in Table 2 take the volatility of the year-on-year changes in Figure 1 out, particularly for work done. At the industry level, the long-run relationship between the average of annual changes in employment and work done is actually stable, with the average smoothing the cyclic variability and the effect of very large projects on the volume of work commenced. Since 2007 the average annual change in work done is an increase of 2 percent, and for employment it is 1 percent. This similarity in the average percentage changes over time indicates that, over this period, the industry has turned inputs into buildings and structures using current production technology (machinery, materials, management etc.) at a high level of technical efficiency. However, there has been no significant change in work done per person employed since 2007 when it was $173,192 and 2022 with $177,446. At the top of the mining boom in 2013 work done per person was $245,353.
Table 2. Percent change in work done and employment 2007-22
Industry | Work done | Employed people |
Engineering Construction | 2% | 3% |
Building Construction | 2% | 3% |
Construction Services | 2% | 1% |
All Construction | 2% | 1% |
Note: Engineering employment and engineering construction. Building and Construction Services and building work done.
Construction Services
The number of people employed in Construction services began to rise with increasing building work and the end of the mining boom. There were big jumps in 2018 and 2021 when residential building work was peaking in the recent cycle. In 2022 Construction services employment reached 854,000, an all-time high, despite the small decrease in the annual value of work done compared to 2018. Between 2013 and 2022 building work done increased by 25 percent and Construction services employment by 20 percent.
Figure 2. Construction services work done and people employed

The increase in Construction services employment followed rising residential building work, as Figure 3 shows. Construction services employment began to increase in 2016, and continued to rise as the level of building work done peaked then fell. This increase in employment while the value of work is falling implies decreasing industry efficiency, possibly due to the large number of new and inexperienced workers that entered the industry. However, there have been a number of factors that affected the volume of work since 2020, such as wet weather, the pandemic, interest rates, shortages, cost increases and other supply chain issues.
Increasing Construction services employment in recent years is in part due to the increasing number of apprenticeships. The construction trades share of all apprenticeships rose from 12 percent in 2016 to 16 percent in 2022 and the number of people in-training in construction trades increased from 52,700 in 2016 to 70,300 in 2022, when the total number of trainees was 419,600, nearly half the number of people employed in Construction services.
Figure 3. Residential and non-residential building work done

What is surprising about Construction services employment is how loosely it is actually connected to changes in the level of work done, both to total construction work and to building work more specifically, where the relationship would be expected to be stronger. However, as Figure 4 shows, in most years there is little connection between changes in the volume of building work done and employment in Construction services, it increased in the last couple of years of the 2014-18 increase in residential building but not during the first few years of the upswing.
Figure 4. Annual change in Construction services employment

Engineering and Building Construction
The number of people employed in Engineering increased from 91,000 in 2007 to a peak of 160,000 in 2013, before falling to 110,000 in 2017 then recovering to 137,000 in 2022. Between 2007 and 2013 engineering work done increased by 107 percent and employment by 76 percent, accounting for the cyclic rise and fall in productivity discussed in the previous post.
Figure 5. Engineering work done and people employed

In Engineering, between 2007 and 2022 the annual percentage changes moved in the same direction and by similar amounts in many years, as Figure 6 shows. In some years the change in work done is 20 percent or more, due to the size of the largest projects, with frequent annual changes in employment of 10 percent.
Figure 6. Annual change in Engineering work done and employment

There is a similar story for Building work done and the number of people employed in Building construction. Over the recent building cycle, driven by residential building, between 2014 and 2018 the value of work done increased by 29 percent and the number of people employed rose by 27 percent. In 2022 the value of work done was slightly down on 2018, but employment had grown from 224,000 to 239,000 people.
Figure 7. Building work done and people employed

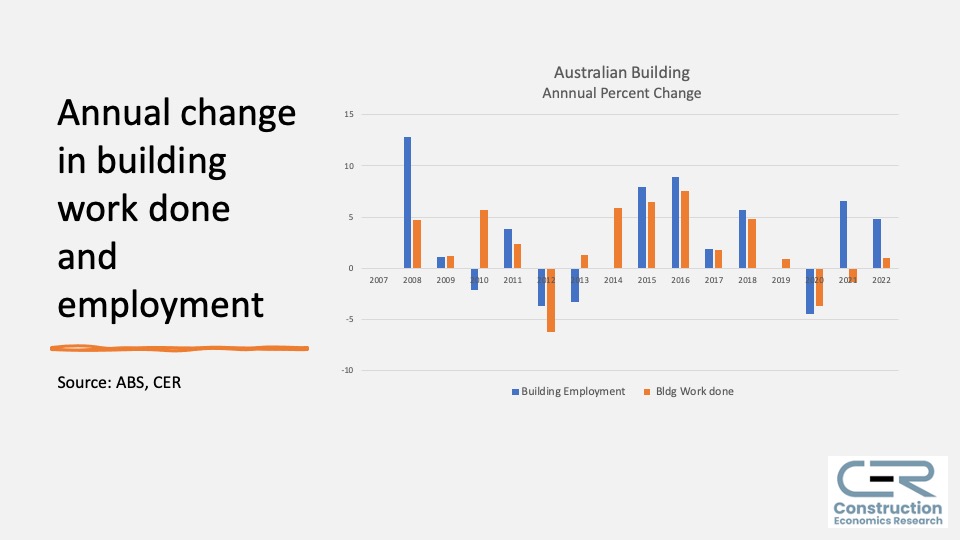
Between 2007 and 2022 the annual percentage changes moved by similar amounts in many years (e.g. 2015-20) but, as Figure 8 shows, in other years there is a lag between changes in building work done and employment. Over time periods longer than one year these annual variations become more closely aligned.
Figure 8. Annual change in building work done and employment
Conclusion
For the construction industry, changes in employment numbers have not been closely linked to changes in work done. Between 2007 and 2022 volume of construction work done peaked in 2014 and 2018, but it took until 2016 before employment started increasing. By 2022 the volume of work done had declined from 2018 but the number of people employed had increased to 1,229,000 people, mainly because of the number of new people in Construction services. The volume of work done after 2020 will also have been impacted by pandemic-era supply chain issues, wet weather, interest rates and cost increases, although the extent of the effect is unknown.
Figure 9. Australian construction work done and employment

Between 2007 and 2022 an increase in construction work done generally required more people, but there has been great variation between the subsectors, with significant changes in both employment and the volume of work done at the subsector level that are not reflected in the industry’s total work done or total employment. There is a clear relationship between changes in engineering work done and changes in Engineering employment, and changes in work done and employment in Building.
Although the number of people employed in construction has been affected by the composition of work, the relationship is weaker for Construction services, where over twice as many people are employed as in Engineering and Building combined. Construction services employment barely changed during the 2010-14 mining boom increase in engineering work, and if building work done is used still shows a limited relationship between changes in employment and changes in work done. Employment rose as building work increased and residential building work peaked in 2018. In 2022 Construction services employment reached a record 854,000, despite a decrease in the volume of building work done.
For the industry subsectors Engineering and Building, annual increases and decreases in employment follow increases and decreases in work done. At this level, annual increases in work done and employment vary greatly over the period 2007 to 2022, but become more aligned over longer time periods. At the peak of their respective cycles, engineering in 2013 and building work done in 2018 had increased by a few percent more than the number of people employed in Engineering and Building respectively, but the changes were similar.
At the industry level, the long-run relationship between the average of annual changes in employment and work done is actually stable, with the average smoothing the cyclic variability and the effect of very large projects on the volume of work commenced. Since 2007 the average annual change in work done is an increase of 2 percent, and for employment it is 1 percent. This similarity in the average percentage changes over time indicates the industry broadly has turned inputs into buildings and structures using current production technology (machinery, materials, management etc.) at a high level of technical efficiency.
However, over the last few years the total volume of work done has been falling but employment has increased, which may in part be because many of these new employees have been replacing experienced workers retiring in their 60s. In 2022 there were 130,000 more people (19 percent) in Construction services than in 2016, and over that period employment also increased in Engineering (by 15,000) and Building (by 31,000). Construction employment has been growing strongly for several years, with increasing numbers of apprenticeships and graduates entering the industry, perhaps attracted by the very significant pipeline of major projects that will, in turn, require retention of these workers.
An increase in employment while the volume of work done is falling implies decreasing industry efficiency, and since 2016 work done has declined by 4 percent while employment has increased by 17 percent. The number of new, inexperienced workers in the industry may be one of the causes of the widening gap between changes in work done and employment since 2020. Labour hoarding during a downturn in the volume of work done due to external factors may also have played a role, as firms retain workers in expectation of future work and potential labour shortages.
In recent years the annual volume of construction work done has been around $220bn. With many major projects still in the planning stage and higher interest rates leading to cancellation or postponement of some projects, building approvals are trending lower and the volume of work done may fall in the short-term. The mismatch between growing employment and a flat or falling volume of work done suggests the industry might have substantial unused capacity at the same time as commencing projects becomes increasingly difficult.