Friday 20 October 2023

Is Productivity Growth in Construction Possible?

Efficiency beats productivity in construction


Has the construction industry reached a level of high efficiency where sustained productivity growth is no longer possible? 
 

The level of technical efficiency of an industry is determined by the technology used in the production process, which is embodied in the machinery, equipment, software and devices available to producers. The most efficient firms in an industry are on or close to the efficiency frontier, and typically there is a distribution of firms within an industry with some small firms having the lowest level of efficiency. Although some firms are on the efficiency frontier, many firms are inside the frontier (i.e. are less efficient), and the level of industry productivity will be around the average level of all firms. Construction fits this picture.


This post first looks at recent research on productivity measurement issues, which finds their well-known problems are not a satisfactory explanation for the lack of growth in construction productivity. Then recent research using Data envelopment analysis (DEA) is reviewed, an econometric method used to measure the efficiency of firms and industries. Construction is found to be at a high level of technical efficiency and close to the limits of current technology. Therefore, to increase construction productivity new technology will be required. 


Productivity and Real Output


Productivity is determined by the amount of machinery and equipment used (physical capital) and the level of skills and training of employees (human capital). Over time, as firms and industries replace old machinery and equipment with new, upgraded versions, productivity is expected to increase. The mystery of construction productivity is why there has been no increase in productivity, despite the improvements in human and physical capital, since the first attempts to measure it in the 1960s (in the US). 


Measurement problems and data issues are the most widely accepted reasons for the lack of construction productivity growth, the construction deflator may underestimate industry output thus lowering the level of measured productivity. However, recent research has found these measurement issues cannot fully account for the lack of productivity growth. The problem is real and another explanation is necessary, with results from a different branch of productivity research suggesting that explanation may be a high level of technical efficiency. 


The accepted reason for the low rate of construction productivity growth is the underestimation of real output, measured as value added (the total value of goods and services produced after deducting the costs in the production process and adjusting for movements in prices).  The construction deflator may not fully take improved quality and relevant input price movements into account, leading to underestimation of real value added. Recent American research has investigated this issue.


Addressing the problem of measuring real output in an industry as diverse as construction, Sveikauskas and colleagues at the US Bureau of Labour Statistics published estimated real construction value added per hour worked in four construction sub-industries, using four specific deflators and including subcontractor hours. Between 2007 and 2020 productivity fell in single-family residential and multiple-family housing construction, but rose in industrial and highway, street, and bridge construction, following a rising volume of work in the latter two sub-industries. Overall productivity for the four sub-industries was flat because these rises and falls balanced out.


Garcia and Molloy asked ‘Can Measurement Error Explain Slow Productivity Growth in Construction?’. Their answer was no, ‘we estimate that productivity was essentially flat in the construction sector from 1987 to 2019,’ although it was not as low as implied by official statistics when they adjusted for the improved quality of houses. Their analysis found a small upward bias in deflators related to unobserved improvements in structure quality, ‘but the magnitude is not large enough to alter the view that construction-sector productivity growth has been weak. We also find only small contributions from other potential sources of measurement error.’ The implication of this research is that a small increase in productivity has been absorbed by higher but unobserved (i.e. not in the data) quality, therefore no growth in measured construction productivity. 


Another recent significant contribution came in a paper from Goolsbee and Syverson with the arresting title ‘The Strange and Awful Path of Productivity in the U.S. Construction Sector”’. The time period is 1950 to 2019. They focus on measurement problems as an explanation of poor performance: ‘we update some of this previous work and extend it to some new data sources and hypotheses. Together, these new approaches seem to reinforce the view that the poor performance is not just a figment of measurement error.’ 


Their paper concludes, however, that measurement error is ‘probably not the sole source of the stagnation’, i.e. the statistics may have some issues, but the problem is real. Construction productivity, despite the obvious improvements in materials, tools and techniques over the last few decades, has not increased. And this is not unique to the US, for countries around the world, the same result has been found. It is a universal problem.


Technical Efficiency


Technical efficiency is defined as the ability of firms and industries to produce as much output as possible, given the inputs of labour and capital used and the level of technology available. At maximum efficiency, to increase output requires adding another input to the system of production, such as an extra worker or another machine.


Data envelopment analysis (DEA) estimates efficiency by measuring the ratio of total inputs employed to total output produced for each member of a group. This ratio is then compared to the others in the sample group of firms, industries or countries to estimate relative efficiency. DEA identifies the most efficient provider of a good or service by the ability to produce a given level of output using the least number of inputs, then measures relative efficiency against that benchmark for the sample group.   


With DEA it is important that the level of technology used is similar across the firms or industries in any comparison. In construction, firms have access to current technology, in the form of materials, components and equipment, and the organization of production is based on high level of standardization of parts and processes. With a few exceptions for specialised work (tunnels etc.), the technology available to and used by firms does not vary much from firm to firm.


DEA has been used to assess productivity and efficiency levels in many industries. DEA was first applied to the construction industry in Hong Kong in the late 1990s, and over the last few years there have been DEA papers on construction in SpainSwedenEuropeHong KongChinaNew Zealand and Australia. This research broadly found construction productivity has slowly increased over time, but it is pro-cyclical and follows rises and falls in the volume of work. There are two other common findings. The first is not surprising, larger firms are more efficient than small ones and there is a significant within-industry difference between the best and worst firms. The second, however, is not so obvious. 


These DEA studies find the overall level of technical efficiency in construction is high, and for the best firms very high. This may not be something many people dealing with the day-to-day information and coordination problems in construction would agree with but, using DEA and industry level data, that is what this research finds. And like productivity, technical efficiency is strongly pro-cyclical, rising and falling as the volume of work increases and falls. Periods of full technical efficiency coincide with periods of the strongest productivity growth.


The industry in all the countries where construction has been analysed with DEA is efficient, based on the econometric instrument of DEA and data on the volume of work, industry value added, capital stock and employment. Full technical efficiency is the complete use of all available inputs of capital and labour in the production of output and value added, or to put it another way, there is a point where the industry is at maximum capacity and there are no underutilised inputs. At that point on the efficiency frontier more input is required to increase output, such as an extra worker or machine. 


This can go a long way as an explanation of the productivity problem. When the level of work is high and increasing, productivity improves until the industry is approaching the efficiency frontier, where more workers are needed to increase output. Therefore productivity stops growing. As the volume of work falls during the contraction phase of the building cycle and firms retain workers in the expectation of future work, so the level of industry productivity falls, ending up where it started. 


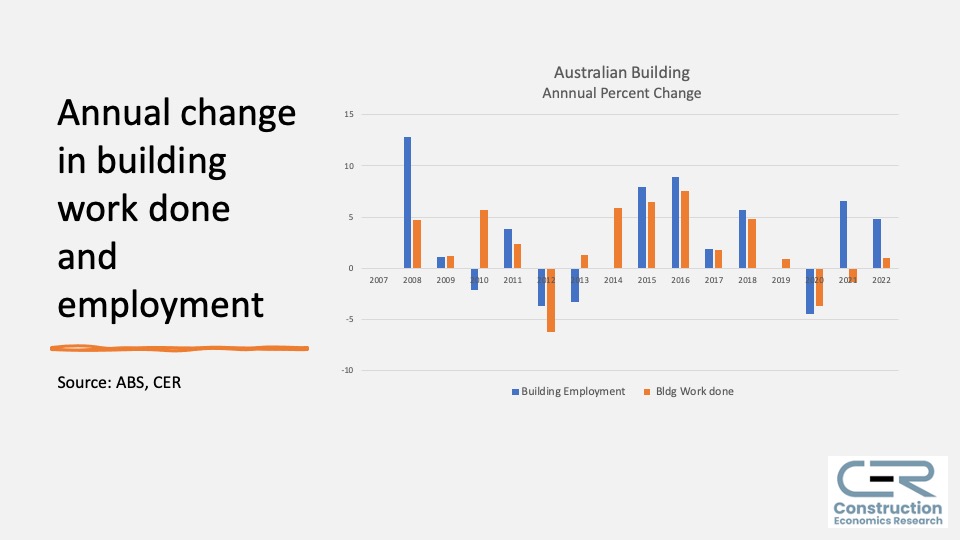
The Australian construction industry illustrates this pattern. Between 2007 and 2022 the volume of construction work done increased by 29 percent, and construction employment by 26 percent. This similarity in the changes over time indicates that, over this period, the industry has turned inputs into buildings and structures using current production technology (machinery, materials, management etc.) at a high level of technical efficiency. It also identifies the strong relationship between an increase in work done (output) and employment, which will also increase. In construction, an increase in output requires more workers, over time productivity as output per worker doesn’t change. 


Figure 1. Three measures of productivity 


Between 2007 and 2022 the industry went through a long cycle as the volume of work done first rose by 50 percent, peaking in 2013, but then contracted by 23 percent between 2013 and 2022.  There was a significant increase in work done per person employed due to the large amount of machinery and equipment required during the engineering construction boom of 2011-14 (e.g. offshore oil rigs and LNG plants). Industry gross value added (broadly the difference between revenue and expenses) per person did not increase as much because that machinery and equipment was purchased as an intermediate input to construction from other industries, resulting in a short-lived, pro-cyclical increase in construction productivity, which ended up where it began.


Conclusion: Why efficiency beats productivity in construction


Despite the efforts made by governments, industry organisations and firms over the past decades, there has been no growth in construction productivity. The rate of growth of productivity of the construction industry has been poor since the 1960s, even by comparison with a long-run overall industry average around two percent a year.


Construction is a labour intensive industry in comparison with manufacturing, with which it is often unfairly compared, but there has been a significant increase in the offsite component of construction, and construction methods have become more capital intensive as the performance of machinery, equipment and tools used has improved. However, the expected productivity growth has not occurred, according to the data from national statistical agencies. 


This is the mystery of construction productivity: why there has there been no increase in labour productivity, despite the improvements in human and physical capital, since the first attempts to measure it in the 1960s? Measurement issues leading to underestimation of output are widely believed to be the main problem, however this is not the case, although there may be some underestimation the lack of growth in construction productivity is real. Another explanation is required, and the high level of technical efficiency in construction is suggested. 


This post first looked at recent research on productivity measurement issues, which finds their well-known problems are not a satisfactory explanation for the lack of growth in construction productivity. Then recent international research using Data envelopment analysis (DEA) is reviewed, an econometric method used to measure the efficiency of firms and industries, defined as the ability of firms and industries to produce as much output as possible, given the inputs of labour and capital used and the level of technology available.


There is a relationship between the technical efficiency and productivity. The same inputs of labour and capital are used, but efficiency is the quantity of output given inputs while productivity is the ratio of output and those inputs. Labour productivity, for example, is the number or value of units produced divided by the number of hours worked or the number of people employed. The DEA studies find the overall level of technical efficiency in construction is high, and for the best firms very high, and is strongly pro-cyclical, rising and falling as the volume of work increases and falls with high levels of technical efficiency and productivity growth at the peak of the cycle. 


The level of technical efficiency is determined by the use of the capital stock available to workers. As the level of capital per worker (machines, software etc.) increases so does output per worker, but as the level of output per worker increases it approaches the limits of the technology currently used in production and, at a high level of technical efficiency, productivity growth is no longer possible. 


If productivity growth is no longer possible with the technology currently used in the system of production, which in construction has been developing for well over one hundred years, industry will focus on efficiency and getting the most out of the labour and capital available. Efficiency trumps productivity in construction. 


Tuesday 26 September 2023

Construction Employment At Record High In Australia

Employment Increases as Work Done Falls


The number of people employed in construction is at record highs. In the ABS Labour Account for June 2023 there were 1,268,472 people employed, an increase of 135,693 people since 2018, the most recent peak in the volume of work done. There is only a weak relationship between changes in the volume of construction work done and the number of people employed in construction, as Figure 1 shows, employment typically rises or falls by one or two percent a year while the annual volume of work done has changed by more than five percent in nine of the 15 years between 2007 and 2022. 

Figure 1. Construction work done and people employed 

Note: The number of people employed includes all workers in June each year, and comes from ABS Australian IndustryThe volume of work done is from the ABS chain volume Value of Construction Work Done, which is expenditure on construction adjusted for inflation.


Figure 1 also shows that, from 2007 to 2010, while the volume of work done was increasing the number of people employed barely changed (by 3,000 people). The 2011 bump in employment was due to increased Construction services employment in public building work done as part of the fiscal response to the financial crisis, and the following year employment fell by half the increase of 2011. The increase in work done in 2012 and 2013 was due to the doubling of Engineering work during the mining boom, which went from $76 billion in 2007 to $158bn in 2013, before falling below $100bn in 2017. The $94bn of engineering work done in 2022 was mainly infrastructure projects in transport and energy. The increase in Construction employment in 2017 and 2018 followed rising residential building, when employment in Construction services also began to increase, and in 2022 there was a total of 1,253,906 people employed in construction, an increase of 121,172 since 2018.


There have been significant changes in both employment and the volume of work done at the subsector level since 2011 that are not reflected in the industry’s total work done or total employment, and a more detailed picture emerges when construction employment in the three industry subsectors of Engineering, Building and Construction services is used, and construction work done is divided into engineering work and building work. There is a clear relationship between changes in engineering work done and Engineering employment, and in building work done and employment in Building. When the recent cycles in engineering and building construction are taken into account there are significant differences between the industry subsectors, and a comparison of changes in construction employment and work done since 2007 is below in Table 1, divided inro trough-to-peak and peak-to-2022 time periods. Between 2007 and 2022 the volume of engineering work done rose by 23 percent but the number of people employed by 51 percent and, for Building, work done rose by 36 percent and the number of people employed by 46 percent. Construction services employment rose by 26 percent, less than the 36 percent increase in building work done. 


Table 1. Changes in work done and employment 2007-2022

Industry


Work done

Employed people

Engineering Construction

2007-13

2018-22

2007-22

107%

-20%

23%

76%

2%

51%

Building Construction

2013-18

2018-22

2007-22

29%

-3%

36%

27%

7%

46%

Construction Services

2013-18

2018-22

2007-22

29%

-3%

36%

9%

11%

19%

All Construction 

2013-18

2018-22

2007-22

-4%

-11%

29%

6%

11%

26%

Note: Engineering employment and engineering construction. Building and Construction Services and building work done.


The long-run averages used in Table 2 take the volatility of the year-on-year changes in Figure 1 out, particularly for work done. At the industry level, the long-run relationship between the average of annual changes in employment and work done is actually stable, with the average smoothing the cyclic variability and the effect of very large projects on the volume of work commenced. Since 2007 the average annual change in work done is an increase of 2 percent, and for employment it is 1 percent. This similarity in the average percentage changes over time indicates that, over this period, the industry has turned inputs into buildings and structures using current production technology (machinery, materials, management etc.) at a high level of technical efficiency. However, there has been no significant change in work done per person employed since 2007 when it was $173,192 and 2022 with $177,446. At the top of the mining boom in 2013 work done per person was $245,353. 

Table 2. Percent change in work done and employment 2007-22

Industry

Work done

Employed people

Engineering Construction

2%

3%

Building Construction

2%

3%

Construction Services

2%

1%

All Construction 

2%

1%

Note: Engineering employment and engineering construction. Building and Construction Services and building work done.


Construction Services


The number of people employed in Construction services began to rise with increasing building work and the end of the mining boom. There were big jumps in 2018 and 2021 when residential building work was peaking in the recent cycle. In 2022 Construction services employment reached 854,000, an all-time high, despite the small decrease in the annual value of work done compared to 2018. Between 2013 and 2022 building work done increased by 25 percent and Construction services employment by 20 percent.

Figure 2. Construction services work done and people employed 


The increase in Construction services employment followed rising residential building work, as Figure 3 shows. Construction services employment began to increase in 2016, and continued to rise as the level of building work done peaked then fell. This increase in employment while the value of work is falling implies decreasing industry efficiency, possibly due to the large number of new and inexperienced workers that entered the industry. However, there have been a number of factors that affected the volume of work since 2020, such as wet weather, the pandemic, interest rates, shortages, cost increases and other supply chain issues. 


Increasing Construction services employment in recent years is in part due to the increasing number of apprenticeships. The construction trades share of all apprenticeships rose from 12 percent in 2016 to 16 percent in 2022 and the number of people in-training in construction trades increased from 52,700 in 2016 to 70,300 in 2022, when the total number of trainees was 419,600, nearly half the number of people employed in Construction services.


Figure 3. Residential and non-residential building work done


What is surprising about Construction services employment is how loosely it is actually connected to changes in the level of work done, both to total construction work and to building work more specifically, where the relationship would be expected to be stronger. However, as Figure 4 shows, in most years there is little connection between changes in the volume of building work done and employment in Construction services, it increased in the last couple of years of the 2014-18 increase in residential building but not during the first few years of the upswing. 


Figure 4. Annual change in Construction services employment


Engineering and Building Construction

The number of people employed in Engineering increased from 91,000 in 2007 to a peak of 160,000 in 2013, before falling to 110,000 in 2017 then recovering to 137,000 in 2022. Between 2007 and 2013 engineering work done increased by 107 percent and employment by 76 percent, accounting for the cyclic rise and fall in productivity discussed in the previous post. 


Figure 5. Engineering work done and people employed 


In Engineering, between 2007 and 2022 the annual percentage changes moved in the same direction and by similar amounts in many years, as Figure 6 shows. In some years the change in work done is 20 percent or more, due to the size of the largest projects, with frequent annual changes in employment of 10 percent.


Figure 6. Annual change in Engineering work done and employment


There is a similar story for Building work done and the number of people employed in Building construction. Over the recent building cycle, driven by residential building, between 2014 and 2018 the value of work done increased by 29 percent and the number of people employed rose by 27 percent. In 2022 the value of work done was slightly down on 2018, but employment had grown from 224,000 to 239,000 people. 


Figure 7. Building work done and people employed


Between 2007 and 2022 the annual percentage changes moved by similar amounts in many years (e.g. 2015-20) but, as Figure 8 shows, in other years there is a lag between changes in building work done and employment. Over time periods longer than one year these annual variations become more closely aligned.


Figure 8. Annual change in building work done and employment


Conclusion

For the construction industry, changes in employment numbers have not been closely linked to changes in work done. Between 2007 and 2022 volume of construction work done peaked in 2014 and 2018, but it took until 2016 before employment started increasing. By 2022 the volume of work done had declined from 2018 but the number of people employed had increased to 1,229,000 people, mainly because of the number of new people in Construction services. The volume of work done after 2020 will also have been impacted by pandemic-era supply chain issues, wet weather, interest rates and cost increases, although the extent of the effect is unknown. 
 

Figure 9. Australian construction work done and employment


Between 2007 and 2022 an increase in construction work done generally required more people, but there has been great variation between the subsectors, with significant changes in both employment and the volume of work done at the subsector level that are not reflected in the industry’s total work done or total employment. There is a clear relationship between changes in engineering work done and changes in Engineering employment, and changes in work done and employment in Building.


Although the number of people employed in construction has been affected by the composition of work, the relationship is weaker for Construction services, where over twice as many people are employed as in Engineering and Building combined. Construction services employment barely changed during the 2010-14 mining boom increase in engineering work, and if building work done is used still shows a limited relationship between changes in employment and changes in work done. Employment rose as building work increased and residential building work peaked in 2018. In 2022 Construction services employment reached a record 854,000, despite a decrease in the volume of building work done.


For the industry subsectors Engineering and Building, annual increases and decreases in employment follow increases and decreases in work done. At this level, annual increases in work done and employment vary greatly over the period 2007 to 2022, but become more aligned over longer time periods. At the peak of their respective cycles, engineering in 2013 and building work done in 2018 had increased by a few percent more than the number of people employed in Engineering and Building respectively, but the changes were similar.


At the industry level, the long-run relationship between the average of annual changes in employment and work done is actually stable, with the average smoothing the cyclic variability and the effect of very large projects on the volume of work commenced. Since 2007 the average annual change in work done is an increase of 2 percent, and for employment it is 1 percent. This similarity in the average percentage changes over time indicates the industry broadly has turned inputs into buildings and structures using current production technology (machinery, materials, management etc.) at a high level of technical efficiency. 


However, over the last few years the total volume of work done has been falling but employment has increased, which may in part be because many of these new employees have been replacing experienced workers retiring in their 60s. In 2022 there were 130,000 more people (19 percent) in Construction services than in 2016, and over that period employment also increased in Engineering (by 15,000) and Building (by 31,000). Construction employment has been growing strongly for several years, with increasing numbers of apprenticeships and graduates entering the industry, perhaps attracted by the very significant pipeline of major projects that will, in turn, require retention of these workers. 


An increase in employment while the volume of work done is falling implies decreasing industry efficiency, and since 2016 work done has declined by 4 percent while employment has increased by 17 percent. The number of new, inexperienced workers in the industry may be one of the causes of the widening gap between changes in work done and employment since 2020. Labour hoarding during a downturn in the volume of work done due to external factors may also have played a role, as firms retain workers in expectation of future work and potential labour shortages.


In recent years the annual volume of construction work done has been around $220bn. With many major projects still in the planning stage and higher interest rates leading to cancellation or postponement of some projects, building approvals are trending lower and the volume of work done may fall in the short-term. The mismatch between growing employment and a flat or falling volume of work done suggests the industry might have substantial unused capacity at the same time as commencing projects becomes increasingly difficult.


Thursday 24 August 2023

The Long Cycle in Australian Construction Productivity


Over the last 15 years, Construction productivity in Australia has gone through a long cycle and ended up more or less where it began. The Australian Bureau of Statistics Construction labour productivity index rose from 92.88 in 2006-07 to 95.36 in 2010-111, before rapidly increasing to 115.94 in 2013-14, then falling to 99.1 in 2021-22. What explains the 10 year cycle between 2011 and 2021?

Productivity estimates require both a measure of labour inputs, such as hours worked or people employed, and a measure of output, called Industry value added (IVA, the difference between total revenue and total costs). IVA is then adjusted for changes in prices of materials and labour to estimate Gross value added (GVA) using price indexes. The ABS has a Construction industry labour productivity index, but does not have separate indexes for the different construction industry sectors.

However, using GVA data, estimates of productivity for the industry sectors of Engineering construction, Building construction and Construction services can be found. The GVA data comes from the ABS National Accounts (chain volume measures of economic activity). The number of people employed includes all workers in June each year, and comes from ABS Australian Industry. The construction work done data is from the ABS chain volume Value of Construction Work Done, which is expenditure on construction adjusted for inflation.

GVA per person employed is a useful proxy for industry productivity. As a combination of real output and employment, GVA per person employed looks like a measure of productivity and, while not precise, it is indicative of industry trends. As a measure of productivity, annual GVA per person employed follows a similar path to the ABS productivity index, which uses the number of hours worked for labour input. If output is increasing faster than employment, labour productivity will also increase.

In Figure 1 Construction GVA per person employed in thousands of dollars per person is compared to the ABS labour productivity index for Construction from their Estimates of Industry Multifactor Productivity. There is a good match between the two because they both use industry GVA for output and are both based on the 2020-21 year, although the long cycle between 2011 and 2021 is more pronounced in the GVA per person data. The ABS labour productivity index is 2020-21 = 100, and went from 92.88 in 2006-07 to 115.94 in 2013-14 before falling to 99.1 in 2021-22.

Figure 1. Construction Gross Value Added per Person Employed and Labour Productivity


In Figure 2 the Value of construction work done is shown with GVA per person employed, and there is a clear relationship between the two. Over the 15 year period Construction work done peaked twice, first in 2014 during the mining boom and then in 2018 with new infrastructure projects. Construction GVA per person followed a similar trend to the rises and falls in work done. 

Figure 2. Gross Value Added per Person Employed and Construction Work Done

Significantly, Figure 2 shows GVA per person employed also peaked in 2014 as it followed changes in work done. Productivity increased when construction was rising after 2011 during the mining boom, and then decreased as the mining boom ended. The first stage of this long-run cycle of increasing construction work done and GVA per person employed in construction was entirely due to the large number of large, capital intensive resource projects completed during the mining boom between 2011 and 2017, followed by transport and energy sectors commencing in the second stage from 2018.

Engineering Construction

The mining boom started in the 2000s but took off after 2010 with many large energy and resource projects. As Figure 3 shows, the value of Engineering work done doubled between 2007 and 2013, and as it did Engineering GVA per person employed increased by around 20%. Engineering GVA per person followed the rise and fall and subsequent fall in the value of work done, and is now well below the peak years. The value of Engineering work done includes associated expenditure on machinery and equipment, so a lot of the increase was due to the capital investment required for the LNG plants, offshore platforms, railways and new mines constructed.

Figure 3. Gross Value Added per Person Employed and Engineering Work Done


Building Construction and Construction Services

Using Australian Industry employment data, GVA per person employed can also be found for both Building construction and Construction services as well as Engineering. Here a slight decline in Building has been offset by a small rise in Construction services GVA per person over the 15 years, as GVA per person since 2006-07 in Building has declined slightly, from $179,000 to $148,000 in 2021-22, while it increased for Construction services, from $84,000 to $102,000. As shown in Figure 4, the level of GVA per person in Construction services is around two-thirds of the level for Building construction, because Construction services are generally labour intensive and will therefore have a lower value of output per person. 

The range in output per person employed between Engineering, Building and Construction services reflects the differences in capital requirements of these three sectors, and expenditure on purchases of software, equipment and machinery by firms in the three sectors. The higher the capital requirements, or capital intensity, of an industry, the higher the level of output per person employed is expected to be, because workers with more capital are more productive. Both excavators and shovels require one operator, but the former shifts more soil.

Figure 4. GVA per Person Employed in Engineering, Building and Construction Services


The strong relationship between the value of Engineering work done and GVA per person seen in Engineering is not found for Building and the value of Building work done. Despite the increase in the value of Building work done after 2014 there was no increase in GVA per person, rather there was a slight decline as residential building increased during the transition after the mining boom, as shown in Figure 5. This may also be an indicator of increased use of prefabrication and offsite manufacturing reducing the value added of onsite work, but we have no reliable data on that. 

Figure 5. Gross Value Added per Person Employed and Building Work Done

For Construction Services there is real GVA but not real work done data, so total construction work done is used in Figure 6, as the trades work across Building and Engineering. Here, GVA per person does increase as work increases, but peaks in 2016 and then falls away. The number of people employed increased from 723,000 in 2015-16 to 854,000 in 2020-21, and may have contributed to the fall in GVA per person if that increase included many new workers with little experience and limited skills. There was a particularly big increase in employment in 2020-21, when over 60,000 more people were employed in Construction services, and employment grew much faster than work done. As a result, GVA per person dropped by $8,000 before recovering in 2021-22.

Figure 6. Gross Value Added per Person Employed and Total Construction Work Done


Conclusion

Over the last 15 years, construction productivity in Australia has gone through a long cycle and ended up more or less where it began. Rising from $115,000 per person employed in 2007 to $149,000 in 2014, an increase of 29%, GVA per person employed then started falling and was back to $125,000 per person in 2022.

This long cycle in Australian construction productivity followed changes in the value of Engineering work done. Productivity increased as Engineering construction rose after 2011, and then decreased as the mining boom ended. This long-run cycle in construction productivity was entirely due to the capital intensive resource projects completed between 2011 and 2017 by Engineering construction, where the machinery and equipment required for LNG plants, offshore platforms and new mines is included in the value of work done. This greatly increased the value of work done, but much of the increase was therefore not invested directly in construction work.

The strong relationship between changes in the value of work done and GVA per person seen in Engineering is not found for Building construction or Construction services. The higher capital intensity of Engineering work appears to lift GVA per person with increasing work done, as more expenditure on machinery and equipment is included in this sector compared to building.

Despite the increase in the value of building work done after 2014 there was no increase in Building GVA per person, rather there was a slight decline. For Construction services, GVA per person did increase to 2016 as construction work done increased, before falling away as the number of people employed increased faster than the value of work done.

What can be taken from this episode? Firstly, over 15 years there has been little change in overall construction labour productivity and, unlike Engineering, for Building and Construction services increasing work done has seen productivity fall slightly since 2014 as employment increased faster than output. Second, the lack of any real trend in construction productivity, despite changes in output and a continual increase in the number of people employed, suggests the industry is at the limits of efficiency, based on current technology. As output increases the number of people also increases, often a bit more than output but sometimes slightly less, so GVA per person is not improving. Therefore the industry may be somewhere close to the efficiency frontier in delivering projects, but there is no trend at either the industry or sector level of increasing productivity.