More recommendations and reform directions focused on regulation and planning

The Queensland Productivity Commission (QPC) released their interim report on Opportunities to Improve Productivity of the Construction Industry on 31st July. Construction productivity has recently been the subject of two other reports, with this one following the NSW Productivity and Equality Commission report Housing Supply Challenges and Policy Options in August 2024 and the Productivity Commission report Housing Construction Productivity: Can We Fix It? in February 2025.
The motivating force behind the three reports is a political requirement to be seen to be doing something to address the housing crisis, which is fundamentally due to a mismatch between a long-term lack of supply of new dwellings and the high level of demand, driven by a combination of increased immigration and decreased household size. The result has been rising house prices, falling affordability, particularly for first home buyers, increased rents and very low vacancy rates. Another factor is the high level of engineering construction, due to the size and number of transport and energy projects, many of which are for the public sector. Queensland also has the effects of additional demand from the 2032 Olympic Games projects, currently estimated at $7 billion (which based on other Olympic Games will be much more).
The QPC report says ‘While many problems were identified, stakeholders were generally confident that better outcomes are possible. There is broad agreement amongst stakeholders, for many of the solutions identified, on how to address the problems facing the industry.’ Unfortunately, some 342 pages later, most of the problems discussed are about regulation and planning, onsite construction productivity barely gets a mention, there is no evidence stakeholders are in agreement on solutions and more information is requested for the recommendations, and how the problems will be addressed is not included because ‘Implementation issues, including prioritisation and sequencing, are not considered in this interim report but will be considered in the final report.’
This post starts with the QPC interim report’s terms of reference and Queensland construction productivity, then looks at the recommendations and reform directions in the report. Some of the report’s key points on planning and approvals and regulation are covered, and other important industry issues and opportunities not addressed in the report are discussed.
The Terms of Reference Were Extremely Broad
To understand how complex the issues surrounding construction productivity are and why this report (and the others) are so unsatisfactory it is necessary to start with the terms of reference given to the QPC (heavily edited to key points) :
• Conditions in Queensland’s housing market, residential development, and non-residential construction, including housing supply and affordability;
• Key trends including input costs, prices, competition, and supply chain developments;
• Factors shaping Queensland’s productivity including legislation and regulation, industrial relations, procurement policies and labour force needs;
• Opportunities for improvement including regulatory and non-regulatory mechanisms;
• Priority areas for reform in the short, medium and long term (including labour, skills and competition, suitability and availability of qualified head contractors and sub-contractors etc.);
• Impact on small and medium scale subcontractors in regional areas and their ability to compete for government tenders due to regulatory requirements;
• Availability of labour, skills development, and matching supply with demand;
• How government procurement and contracting arrangements affect construction productivity, including Best Practice Industry Conditions (BPICs are wages and conditions on public projects introduced to encourage enlistment of workers);
• Barriers to entry, investment and innovation in the sector.
Including issues around government procurement and contracting allowed the QPC to address some important productivity determinants that were not in the other recent reports. However, the problem is the breadth of these terms of reference, and the loose or long-term relationship many of the others have with onsite construction productivity, which is what is being measured by the statistics.
The QPC report, and the NSW and Productivity Commission reports that preceded it, are not really about construction productivity, which is being used as a stalking horse for the long-term lack of supply of new housing. These reports are more concerned with the complex, cumbersome and sclerotic planning and approvals process that deters, delays and prevents residential construction, and the effects of regulation and the building code.
Queensland Construction Productivity
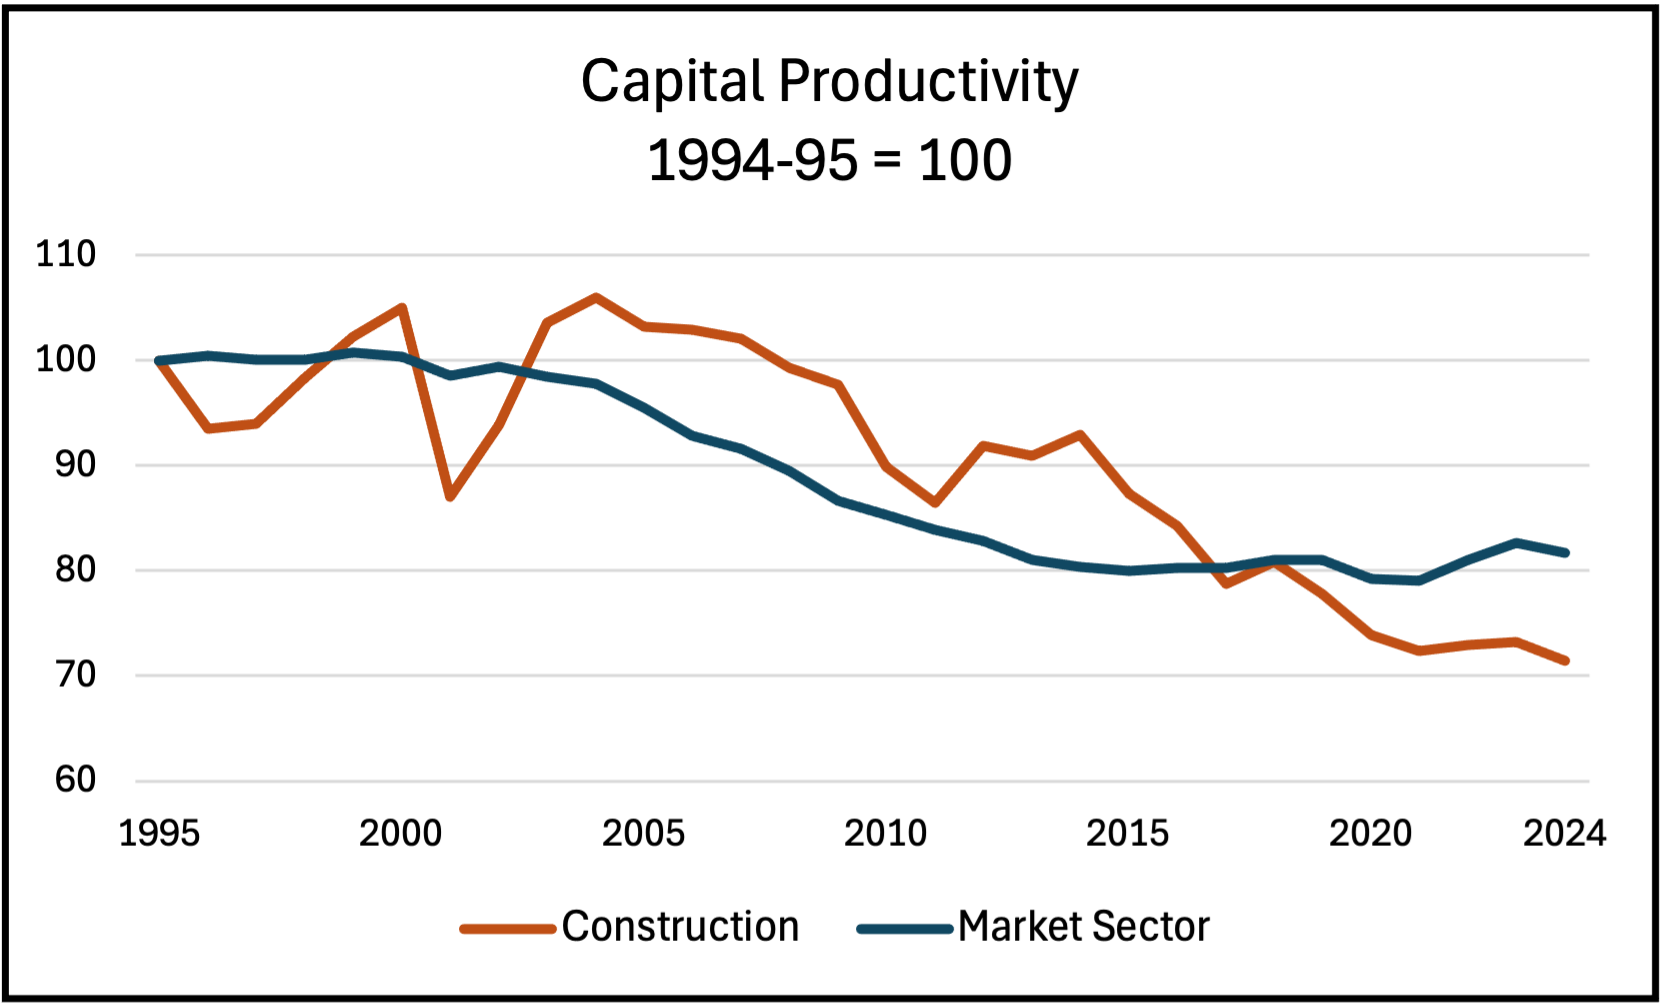
The QPC found Queensland construction productivity is only 5 per cent higher than it was in 1994-95, compared to a 65 per cent increase in labour productivity in the market economy. As Figure 1 shows, the variation in aggregate productivity is explained by compositional changes due to the rapid growth and subsequent decline in heavy and civil engineering activity in the LNG investment boom.
Figure 1. Queensland productivity

This is also what a previous post on construction productivity in the states and territories found. In 2014 the Australian mining boom peaked with the value of work done reaching $80 billion in Queensland, mainly due to construction of three LNG plants. The pro-cyclical nature of construction productivity is clearly seen in Figure 2 as gross value added (GVA) per hour worked followed the fall in the volume of work, which declined by around 30 percent in Queensland [1].
Figure 2. Gross value added per hour worked and construction work done

Sources: ABS 5220, ABS 6150, ABS 8755.
The quotes below on the causes of slow productivity growth have been taken from the QPC report.
‘Although empirical evidence on the causes of slow productivity growth is incomplete, it suggests that regulation is likely to have played a key role’:
· Evidence from the United States and New Zealand suggests restrictive land use regulation may have made it more difficult and expensive to construct housing and other buildings [2].
· Research suggests there have been significant increases in the complexity of building regulation, which has increased overheads and construction costs.
· Regulatory design, including regional variations, have created incentives that keep the industry fragmented and dominated by smaller firms, who are less likely to innovate and have lower productivity.
· Where regulators have poor incentives or are underfunded, results in unnecessary delays, high administrative costs and poor oversight, which can undermine productivity.
‘Recent changes to the National Construction Code (NCC) have been adopted without a case being established that they would provide a net benefit to the community. Similarly, Queensland introduced its trust accounts framework without undertaking a regulatory impact assessment.’
‘While regulatory issues seem to be a key driver of poor performance over longer time periods, more recent productivity declines seem to have been materially impacted by policy choices relating to Queensland Government procurement.’
‘Insufficient attention has been given to how procurement practices or new projects are impacting the market. This has been exacerbated by poor project selection.’
‘Government procurement practices, particularly BPICs, have created unnecessary inefficiencies’
The Report’s Recommendations and Reform Directions
The preliminary recommendations are ‘specific reforms that the Commission is seeking feedback on.’ There are 21 recommendations, of which six are on planning and approvals, and four on the NCC and regulation. The recommendations are:
· Government procurement - recommendations 1, 2 and 3;
· BPICs removal – recommendation 4;
· Planning and approvals – recommendations 5, 6 (infrastructure charges), 7, 8, 9, and 10;
· Regulation – recommendations 11 (NCC), 12 (building codes), 13 (minimum financial requirements), and 14 (trust accounts);
· Modern methods of construction (MMC) – recommendation 15;
· Worker health and safety – recommendations 16 and 17;
· Workforce – recommendations 18 and 19 (occupational licensing), and 20 (mobility);
· Utility connections - recommendation 21.
The reform directions are ‘areas where there is a clear case for action, but the Commission is seeking further information to support the development of specific recommendations.’ There are 12 reform directions, of which
· Government selection and staging of infrastructure – reform direction 1;
· The pre-qualification system – reform direction 2;
· Re-setting industry practices and increasing competition – reform direction 3;
· Tendering and contracting, including building information modelling (BIM) and collaborative contracts - reform direction 4;
· Planning and zoning reform – reform directions 5, 6 (community support);
· Review of regulations – reform directions 7 and 8 (QBCC);
· Worker health and safety - reform direction 9;
· Workforce - reform directions 10 (training), 11 (migration), 12 (labour hire).
There are also two requests for information, on the 2024 Energy Queensland Union Collective Agreement, and on foreign investor taxes and housing construction.
If the aim really is to improve construction productivity, recommendations would be focused on improving project management, logistics and supply chain efficiency, increasing investment in machinery, equipment and software, contractual relations and the structure of the industry. While the recommendations on procurement are important, and with those on workforce development and industrial relations relevant to productivity, the majority of the QPC’s recommendations are on legislation, regulation, and the planning and approvals process.
A comparison with the 2024 NSW Productivity and Equality Commission report Review of Housing Supply Challenges and Policy Options for NSW is useful. That report found barriers to housing supply included high construction and borrowing costs, capacity constraints in the construction sector, and bottlenecks in the development process, with over half of the 32 recommendations on planning. It recommended reforming planning to streamline the development process and reduce approval times, and reviewing planning policy because ‘prescriptive rules’ on land block innovation. Other recommendations included education and skills, business regulations and tax, improving infrastructure and transport, replacing stamp duty with a land tax, establishing an Urban Development Program to report on the housing market and a housing supply council to advise on housing targets, and incentives for local government to meet targets. It argued for non-regulatory approaches wherever possible, and avoiding excessive regulation. While there are many overlapping recommendations, this is a more ambitious agenda than the one envisaged by the QPC.
The structure of the QPC Interim Report echoes the Productivity Commission’s February report, which had five issues and seven reform directions. The PC’s issues were: the complex and slow approvals process; fragmentation due to regulation; the lack of innovation; the regulatory burden; and workforce issues. The reform directions were: coordinated and transparent planning approvals and appropriately funded regulators; review building regulations and the NCC’s objectives; implement ratings systems on new and existing building quality; increase diffusion of technology; public research and development funding; reduce regulatory impediments to MCC; and improve workforce mobility and flexibility. The PC suggested states should consider establishing coordination bodies to speed up the process and address delays such as the Queensland State Assessment and Referral Agency, which got two mentions but no discussion in the QPC report [3].
The Planner Productivity Problem
Over 45 pages the QPC details regulation of land use that ‘can be complex, restrictive, inconsistent across local governments, inconsistent between regulatory instruments and impose costly and unnecessary requirements’, a planning system that ‘is complex, difficult to navigate, inefficient and lacks transparency and accountability’, and approvals processes that ‘create uncertainty, have high transaction costs, require expensive or unnecessary modifications to building design or cause excessive delays.’
The QPC recommends an alternative development pathway for significant developments [4], amending the Planning Regulation, and reviewing the Building and Planning Acts. The Government should ‘investigate digital planning and permitting technologies to improve the efficiency, accuracy and transparency of the approval process.’ To ‘build community support for housing development’ the QPC suggests improved consultation, citizen panels, independent hearing panels, and negotiable conditions. To improve zoning financial incentives for local government might be used.
It is universally recognised that the time and cost of development approvals is a problem, but that is an issue of planner productivity not construction productivity. Research from YIMBY Melbourne found ‘In 1986, for every practicing planner, Australia built around 54 homes. Now, we build fewer than nine homes per planner. A planner 40 years ago was on average responsible for the development of six times the number of homes per year than a planner working today.’
Figure 3. Planner productivity

Source: There is no planner supply shortage, YIMBY Melbourne Research Note.
The Research Note concluded ‘The demand for planners has mainly increased not through an increase in construction output and project delivery, but through an increase in regulatory process and complexity.’ This is QPC’s reform direction 4, and addresses
the problem that development projects such as new housing estates and apartment complexes can take ten years or more to complete, with most of the time spent getting approvals.
Regulation and the NCC
The QPC says ‘evidence suggests that several regulations affecting the construction industry are not effective or efficient, and are likely to be reducing productivity. Building regulations are becoming more complex with increased risk they are impeding productivity. Reduced levels of attention are being paid to the costs of new regulation, with regulatory best practice not being followed.’
Figure 4. The Queensland building regulation system

The outcome is the QPC’s view that recent changes to NCC 2022 for liveable housing and energy efficiency have increased construction costs, and ‘regulatory impact analysis undertaken showed these benefits were unlikely to justify the costs they impose.’ The recommendation is for Queensland to opt out of NCC 2022 and ‘only adopt future NCC changes in Queensland codes where these have been through robust regulatory impact analysis to demonstrate they provide net benefits to the community.’
Under Reform direction 8 ‘consideration should be given to whether the regulatory framework underpinning the QBCC provides the right incentives for ongoing
improvements to regulatory performance.’
Modern Methods of Construction and BIM
There is a short chapter in the interim report on MMC, included in the section on regulation. The QPC argues there is no market failure and no reason for government intervention to promote MMC. The report makes some general observations about regulatory barriers to MMC, none of which are new, and did not endorse MMC as an alternative to conventional building. There is no discussion on the cyclical boom-bust nature of residential building, which makes industrialisation of modular and prefabricated housing difficult, the reluctance of most banks to finance modular and prefabricated houses, and the lack of standards or an industry quality assurance accreditation system for modular and prefabricated buildings.
The QPC acknowledges the existence of the MMC program that QBuild and the Office of the Queensland Government Architect have, which is a partnership with 12 industry suppliers to supply housing in regional and remote areas. In 2023 QBuild established a training and production facility at Eagle Farm in Brisbane, and two more production facilities have since opened in Zillmere in north Brisbane, and Cairns in Far North Queensland.
Although QBuild has the best developed MMC program in Australia that has produced over 500 houses, the QPC does not discuss or make any recommendation on the program. The QPC did not use the opportunity to report data from QBuild on MMC productivity, costs and time performance, or provide feedback from occupants on the build quality and liveability of their houses, or from users of modular or prefabricated public buildings like schools and hospitals.
Another oversight is the lack of discussion on the use of Building Information Modelling (BIM) or other digital tools like design for manufacture and assembly (DfMA). These are making offsite manufacturing of building modules and components more efficient and have been used for over a decade. At the end of the section on Contracting for Efficiency the QPC asks for information on ‘the key barriers to increased adoption of digital technologies, such as BIM, and the policies or practices that would allow the opportunities for digital technologies to be fully leveraged.’
Queensland has had a BIM mandate for public projects over $50 million since 2019, however the QPC does not think this worth mentioning or, worse, investigating. This was another missed opportunity to assess the costs and benefits of their BIM mandate, and the failure to recommend its retention and/or extension a mystery. Also, the BIM mandate is under the Queensland Department of State Development and Infrastructure, which has a 2024 Infrastructure and Workforce Productivity Plan with details on current and planned initiatives, The QPC does not refer to this plan or its effectiveness [5].
Industry Issues
There are other important industry issues not discussed, starting with construction costs and the volatility of the building cycle. Improving productivity through better project management and reform of the VET system are also overlooked. There is no discussion of digitisation and automation, digital tools and platforms, AI enhanced systems, and automated planning and code compliance checks. Also, industry contractual relationships and risk allocation are not considered. Subcontracting is flexible and a method to manage costs and risk, but direct employment has a smaller span of control and is more efficient.
Although there is extensive coverage of building regulation and the NCC, the QPC does not discuss building defects and the lack of implementation of the 2018 report Building Confidence: Improving the Effectiveness of Compliance and Enforcement Systems for the Building and Construction Industry Across Australia recommendations on mandatory inspections and fire safety. Nor is the problem of flammable cladding in Queensland in the report, where from 2019 to 2023 there was a Safer Buildings Taskforce to advise the government on policies and actions and how to rectify combustible cladding. In August 2025 three public buildings still needed rectification and some unknown number have been rectified and removed from the online list on The Department of Housing and Public Works page, which says: ‘As of 31 May 2024:
· 976 private buildings require a solution to address cladding risk;
· 308 are potentially at risk and need to complete the checklist process;
· 345 have notified of removal or rectification.
Although the terms of reference were to look at other jurisdictions, there is no discussion of the NSW iCIRTsystem, developed by ratings agency Equifax, for assessing contractor and consultant capability and performance, despite clear evidence of the effectiveness of the system in NSW in improving building quality and addressing the problems of building defects and phoenixing by developers and contractors. Discussion of the 10 year latent defects insurance scheme that has started in NSW is also missing.
Conclusion
The QPC has focused on regulation and planning as the main issues, but these are just two of the factors that affect onsite productivity, and arguably skills, technology and project management are more important. Also, while no-one disputes the importance of issues like costs, prices, competition, the supply chain, labour, skills, occupational licensing, procurement and contracting, these have been discussed and dissected over and over again. The QPC makes no new contribution to these issues.
The QPC’s 21 recommendations and seven reform directions are in four key areas. The first is improving government procurement policies, where well-known ideas on collaborative contracting, and selecting, sequencing, and sizing of public projects are recycled. These would all make the Queensland Government a better client and would probably increase productivity on public projects, but that can only have a small effect on the overall level of construction productivity in the state because most of the work done is for the private sector. The Queensland Government (and the other Australian Governments) have received these recommendations many times over the years.
The second key area is improving land use regulations, including approvals and zoning, which are a third of the recommendations. The QPC does not directly address the reality that local government opposes new housing, although it does recommend an alternative development pathway for significant developments and reviewing the Building and Planning Acts. The issue here is planner productivity, which has fallen as regulatory complexity has increased, not construction productivity. Planning and zoning decisions have no effect on supply side issues such as the cost of construction materials and mortgage finance for new housing, providing the infrastructure needed for new developments, and the rate of conversion of approvals into commencements by developers.
The third key area is the regulation of building activity. The QPC recommends opting out of the 2022 NCC updates on building accessibility and thermal performance because of their cost effects, reviewing the regulatory framework and performance of the QBCC, and pausing rollout of trust accounts while investigating their costs and benefits. The QPC argues no government support for MMC is required, but regulatory barriers should be addressed.
The fourth key area is improving labour market operation, mainly through reform of apprenticeship and training pathways, occupational licencing, skilled overseas migration, labour hire licensing, and allowing recognition of qualifications from interstate. These issues were recognised and had similar recommendations in the NSW and Productivity Commission reports.
What the QPC report shows is that construction productivity in general, and residential productivity in particular, is being used as a stalking horse for the lack of supply of new housing. As in the previous reports from the NSW Productivity and Equality Commission and the Productivity Commission, the main focus is on a sclerotic planning and approvals process that delays and often prevents new housing. The real issue there is local government opposition to new housing and planner productivity, not construction productivity.
Houses are larger and apartments smaller than a few decades ago, but how they are procured and built, and what they are made of, has not substantially changed in decades. Fundamentally, that is also why the level of productivity has not changed. While there are more electrical appliances and offsite manufacturing of trusses, windows, doors and cabinetry, the building structure and services like electricity, water and plumbing in a 1960s dwelling are those found in a new build today.
Construction in general and housing in particular has a well-established system of production that is efficient and flexible. It will only change if and when there is a clearly superior method of delivery that is also profitable. Tinkering with regulations, the NCC, planning and approvals processes, and occupational licensing might make a difference at the margin, but will not deliver the big improvement in productivity that is required. For that a commitment to increased digitisation and automation is necessary, with government policies, procurement and finance aligned.
There are some glaring omissions in the report. The QBuild MMC has produced over 500 houses, but the QPC does not discuss or make any recommendation on the program. Queensland has had a BIM mandate for public projects over $50 million since 2019, however the QPC does not think this worth mentioning or, worse, investigating. There is almost no discussion on the use of BIM or other digital tools like design for manufacture and assembly. Construction costs and the volatility of the building cycle, improving productivity through better project management and reform of the VET system are also overlooked. Although there is extensive coverage of building regulation and the NCC, the QPC does not discuss building defects and the lack of implementation of the 2018 Building Confidence report.
The productivity issues in the QPC report are not new and can be found in many other reports on the industry, although there are some that are specific to Queensland. The interim report’s recommendations are limited and most would be little more than modifications to the current system. While those may be worthwhile, because the current system can clearly be improved, there is no suggestion that a more radical approach might be needed or taken.
[1] The effect of the mining boom was the subject of a 2023 post on The Long Cycle in Australian Construction Productivity using GVA per person employed.
[2] The US research was discussed in an October 2024 post Recent Research on Construction Productivity.
[3] Discussed in the post Housing Productivity Report a Missed Opportunity on the Productivity Commission’s report Housing Construction Productivity: Can We Fix It?
[4] The QPC does not refer to the NSW Housing Development Authority, established in January 2025 to approve State Significant Developments and rezonings. By August it had approved 187 projects with over 70,000 dwellings. NSW has introduced a Pattern Book of six low and mid-rise housing designs with a 10 day approval pathway. Also in August, Victoria introduced a Single Home Code for deemed-to-satisfy houses that need no further approvals. This follows the Townhouse and Low-Rise Code introduced earlier in 2025.
[5] A 2021post was on BIM Mandates and Construction Industry Policy